Barbadian vs Chippewa Unemployment Among Ages 20 to 24 years
COMPARE
Barbadian
Chippewa
Unemployment Among Ages 20 to 24 years
Unemployment Among Ages 20 to 24 years Comparison
Barbadians
Chippewa
12.9%
UNEMPLOYMENT AMONG AGES 20 TO 24 YEARS
0.0/ 100
METRIC RATING
318th/ 347
METRIC RANK
12.3%
UNEMPLOYMENT AMONG AGES 20 TO 24 YEARS
0.0/ 100
METRIC RATING
305th/ 347
METRIC RANK
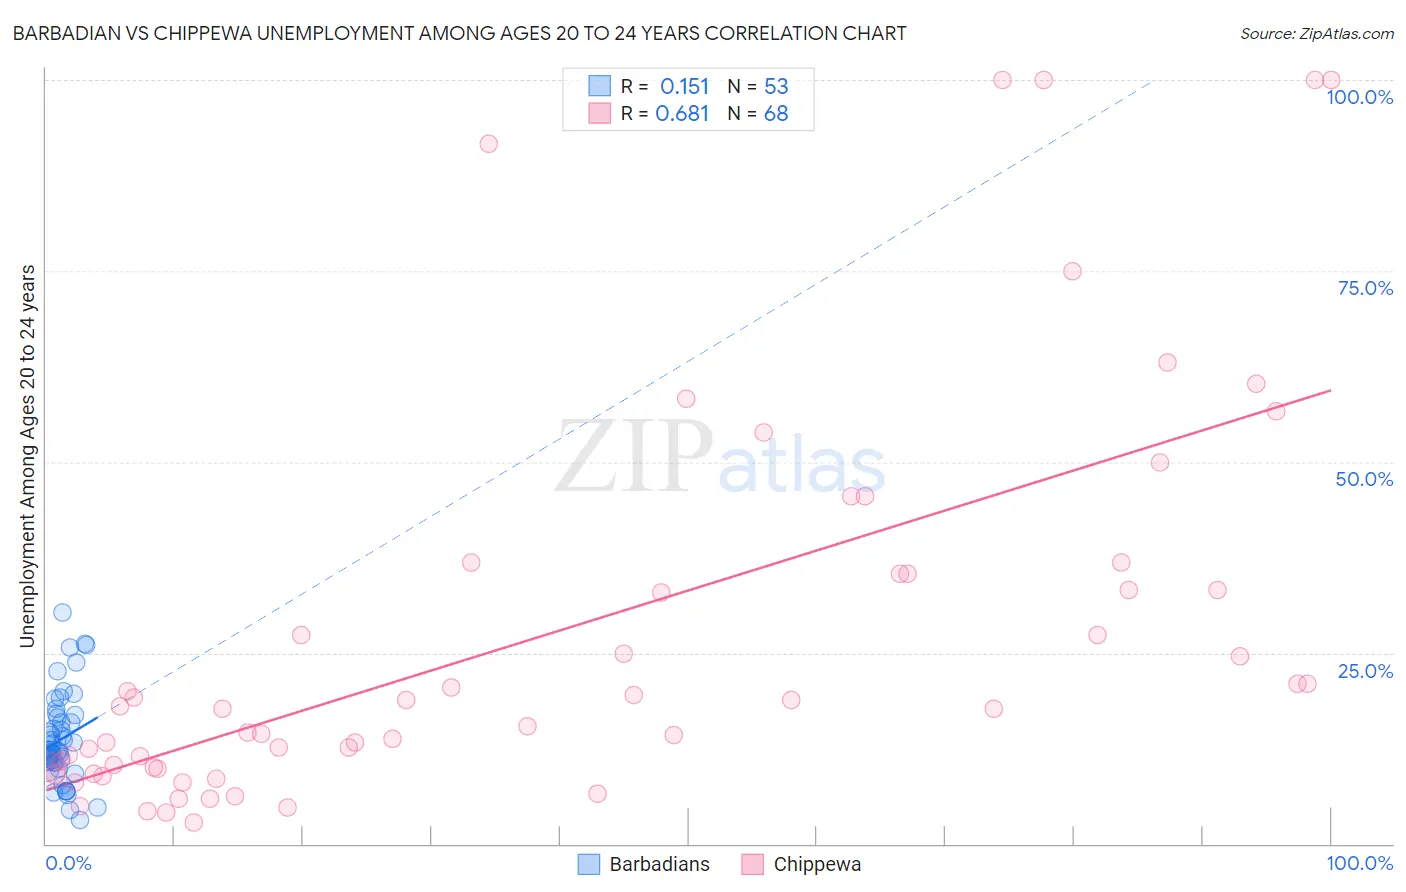
Barbadian vs Chippewa Unemployment Among Ages 20 to 24 years Correlation Chart
The statistical analysis conducted on geographies consisting of 140,027,107 people shows a poor positive correlation between the proportion of Barbadians and unemployment rate among population between the ages 20 and 24 in the United States with a correlation coefficient (R) of 0.151 and weighted average of 12.9%. Similarly, the statistical analysis conducted on geographies consisting of 208,606,929 people shows a significant positive correlation between the proportion of Chippewa and unemployment rate among population between the ages 20 and 24 in the United States with a correlation coefficient (R) of 0.681 and weighted average of 12.3%, a difference of 4.6%.
Unemployment Among Ages 20 to 24 years Correlation Summary
| Measurement | Barbadian | Chippewa |
| Minimum | 3.1% | 2.8% |
| Maximum | 30.3% | 100.0% |
| Range | 27.2% | 97.2% |
| Mean | 13.7% | 27.4% |
| Median | 12.2% | 17.8% |
| Interquartile 25% (IQ1) | 10.6% | 9.9% |
| Interquartile 75% (IQ3) | 16.7% | 35.4% |
| Interquartile Range (IQR) | 6.1% | 25.5% |
| Standard Deviation (Sample) | 5.9% | 26.0% |
| Standard Deviation (Population) | 5.8% | 25.8% |
Demographics Similar to Barbadians and Chippewa by Unemployment Among Ages 20 to 24 years
In terms of unemployment among ages 20 to 24 years, the demographic groups most similar to Barbadians are Immigrants from Trinidad and Tobago (12.8%, a difference of 0.25%), Trinidadian and Tobagonian (12.9%, a difference of 0.25%), Immigrants from Dominica (12.8%, a difference of 0.37%), Cheyenne (13.0%, a difference of 0.68%), and Immigrants from Jamaica (13.0%, a difference of 0.76%). Similarly, the demographic groups most similar to Chippewa are Immigrants from West Indies (12.3%, a difference of 0.040%), Haitian (12.2%, a difference of 0.64%), Immigrants from Cabo Verde (12.2%, a difference of 0.65%), Immigrants from Haiti (12.4%, a difference of 0.84%), and Bermudan (12.5%, a difference of 1.3%).
| Demographics | Rating | Rank | Unemployment Among Ages 20 to 24 years |
| Immigrants | Sierra Leone | 0.0 /100 | #301 | Tragic 12.1% |
| Immigrants | Cabo Verde | 0.0 /100 | #302 | Tragic 12.2% |
| Haitians | 0.0 /100 | #303 | Tragic 12.2% |
| Immigrants | West Indies | 0.0 /100 | #304 | Tragic 12.3% |
| Chippewa | 0.0 /100 | #305 | Tragic 12.3% |
| Immigrants | Haiti | 0.0 /100 | #306 | Tragic 12.4% |
| Bermudans | 0.0 /100 | #307 | Tragic 12.5% |
| Tohono O'odham | 0.0 /100 | #308 | Tragic 12.5% |
| Immigrants | Bangladesh | 0.0 /100 | #309 | Tragic 12.6% |
| Jamaicans | 0.0 /100 | #310 | Tragic 12.6% |
| Vietnamese | 0.0 /100 | #311 | Tragic 12.6% |
| Houma | 0.0 /100 | #312 | Tragic 12.6% |
| Shoshone | 0.0 /100 | #313 | Tragic 12.7% |
| Blacks/African Americans | 0.0 /100 | #314 | Tragic 12.7% |
| West Indians | 0.0 /100 | #315 | Tragic 12.8% |
| Immigrants | Dominica | 0.0 /100 | #316 | Tragic 12.8% |
| Immigrants | Trinidad and Tobago | 0.0 /100 | #317 | Tragic 12.8% |
| Barbadians | 0.0 /100 | #318 | Tragic 12.9% |
| Trinidadians and Tobagonians | 0.0 /100 | #319 | Tragic 12.9% |
| Cheyenne | 0.0 /100 | #320 | Tragic 13.0% |
| Immigrants | Jamaica | 0.0 /100 | #321 | Tragic 13.0% |