Bahamian vs Immigrants from Central America Disability Age Under 5
COMPARE
Bahamian
Immigrants from Central America
Disability Age Under 5
Disability Age Under 5 Comparison
Bahamians
Immigrants from Central America
1.3%
DISABILITY AGE UNDER 5
7.1/ 100
METRIC RATING
226th/ 347
METRIC RANK
1.2%
DISABILITY AGE UNDER 5
61.4/ 100
METRIC RATING
166th/ 347
METRIC RANK
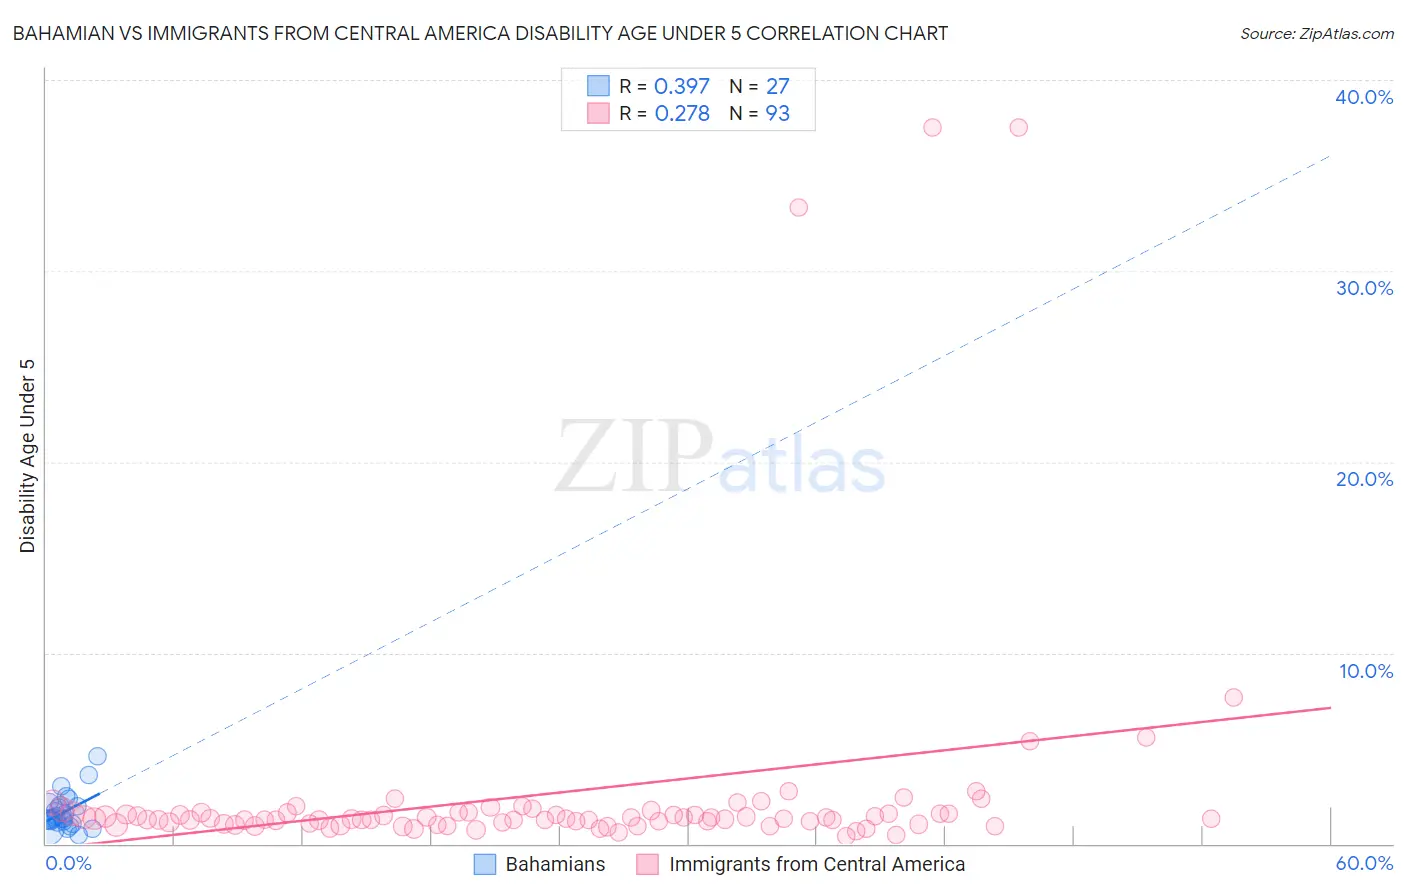
Bahamian vs Immigrants from Central America Disability Age Under 5 Correlation Chart
The statistical analysis conducted on geographies consisting of 81,811,004 people shows a mild positive correlation between the proportion of Bahamians and percentage of population with a disability under the age of 5 in the United States with a correlation coefficient (R) of 0.397 and weighted average of 1.3%. Similarly, the statistical analysis conducted on geographies consisting of 255,387,809 people shows a weak positive correlation between the proportion of Immigrants from Central America and percentage of population with a disability under the age of 5 in the United States with a correlation coefficient (R) of 0.278 and weighted average of 1.2%, a difference of 7.0%.
Disability Age Under 5 Correlation Summary
| Measurement | Bahamian | Immigrants from Central America |
| Minimum | 0.43% | 0.41% |
| Maximum | 4.6% | 37.5% |
| Range | 4.1% | 37.1% |
| Mean | 1.7% | 2.6% |
| Median | 1.3% | 1.3% |
| Interquartile 25% (IQ1) | 1.1% | 1.1% |
| Interquartile 75% (IQ3) | 2.0% | 1.6% |
| Interquartile Range (IQR) | 0.92% | 0.53% |
| Standard Deviation (Sample) | 0.92% | 6.2% |
| Standard Deviation (Population) | 0.90% | 6.2% |
Similar Demographics by Disability Age Under 5
Demographics Similar to Bahamians by Disability Age Under 5
In terms of disability age under 5, the demographic groups most similar to Bahamians are Panamanian (1.3%, a difference of 0.0%), Latvian (1.3%, a difference of 0.030%), Hispanic or Latino (1.3%, a difference of 0.19%), Taiwanese (1.3%, a difference of 0.34%), and Luxembourger (1.3%, a difference of 0.35%).
| Demographics | Rating | Rank | Disability Age Under 5 |
| Immigrants | Croatia | 11.2 /100 | #219 | Poor 1.3% |
| Serbians | 9.6 /100 | #220 | Tragic 1.3% |
| Sub-Saharan Africans | 8.3 /100 | #221 | Tragic 1.3% |
| Ukrainians | 8.3 /100 | #222 | Tragic 1.3% |
| Hispanics or Latinos | 7.7 /100 | #223 | Tragic 1.3% |
| Latvians | 7.1 /100 | #224 | Tragic 1.3% |
| Panamanians | 7.1 /100 | #225 | Tragic 1.3% |
| Bahamians | 7.1 /100 | #226 | Tragic 1.3% |
| Taiwanese | 6.1 /100 | #227 | Tragic 1.3% |
| Luxembourgers | 6.1 /100 | #228 | Tragic 1.3% |
| Immigrants | Costa Rica | 5.5 /100 | #229 | Tragic 1.3% |
| Lebanese | 5.3 /100 | #230 | Tragic 1.3% |
| Immigrants | Northern Europe | 4.7 /100 | #231 | Tragic 1.3% |
| French American Indians | 4.5 /100 | #232 | Tragic 1.3% |
| Tongans | 4.2 /100 | #233 | Tragic 1.3% |
Demographics Similar to Immigrants from Central America by Disability Age Under 5
In terms of disability age under 5, the demographic groups most similar to Immigrants from Central America are Immigrants from Kuwait (1.2%, a difference of 0.11%), Immigrants from Argentina (1.2%, a difference of 0.11%), Laotian (1.2%, a difference of 0.13%), Immigrants from Guatemala (1.2%, a difference of 0.18%), and Guatemalan (1.2%, a difference of 0.21%).
| Demographics | Rating | Rank | Disability Age Under 5 |
| Colombians | 65.8 /100 | #159 | Good 1.2% |
| Immigrants | Latin America | 65.8 /100 | #160 | Good 1.2% |
| Immigrants | Africa | 65.1 /100 | #161 | Good 1.2% |
| Guatemalans | 63.6 /100 | #162 | Good 1.2% |
| Immigrants | Guatemala | 63.2 /100 | #163 | Good 1.2% |
| Laotians | 62.8 /100 | #164 | Good 1.2% |
| Immigrants | Kuwait | 62.6 /100 | #165 | Good 1.2% |
| Immigrants | Central America | 61.4 /100 | #166 | Good 1.2% |
| Immigrants | Argentina | 60.2 /100 | #167 | Good 1.2% |
| Sierra Leoneans | 59.1 /100 | #168 | Average 1.2% |
| Immigrants | Uruguay | 59.0 /100 | #169 | Average 1.2% |
| Immigrants | Jamaica | 58.8 /100 | #170 | Average 1.2% |
| Guamanians/Chamorros | 57.8 /100 | #171 | Average 1.2% |
| Crow | 51.0 /100 | #172 | Average 1.2% |
| Immigrants | Ireland | 50.3 /100 | #173 | Average 1.2% |