Austrian vs Immigrants from Latvia Disability Age 18 to 34
COMPARE
Austrian
Immigrants from Latvia
Disability Age 18 to 34
Disability Age 18 to 34 Comparison
Austrians
Immigrants from Latvia
7.1%
DISABILITY AGE 18 TO 34
1.3/ 100
METRIC RATING
237th/ 347
METRIC RANK
6.4%
DISABILITY AGE 18 TO 34
86.4/ 100
METRIC RATING
143rd/ 347
METRIC RANK
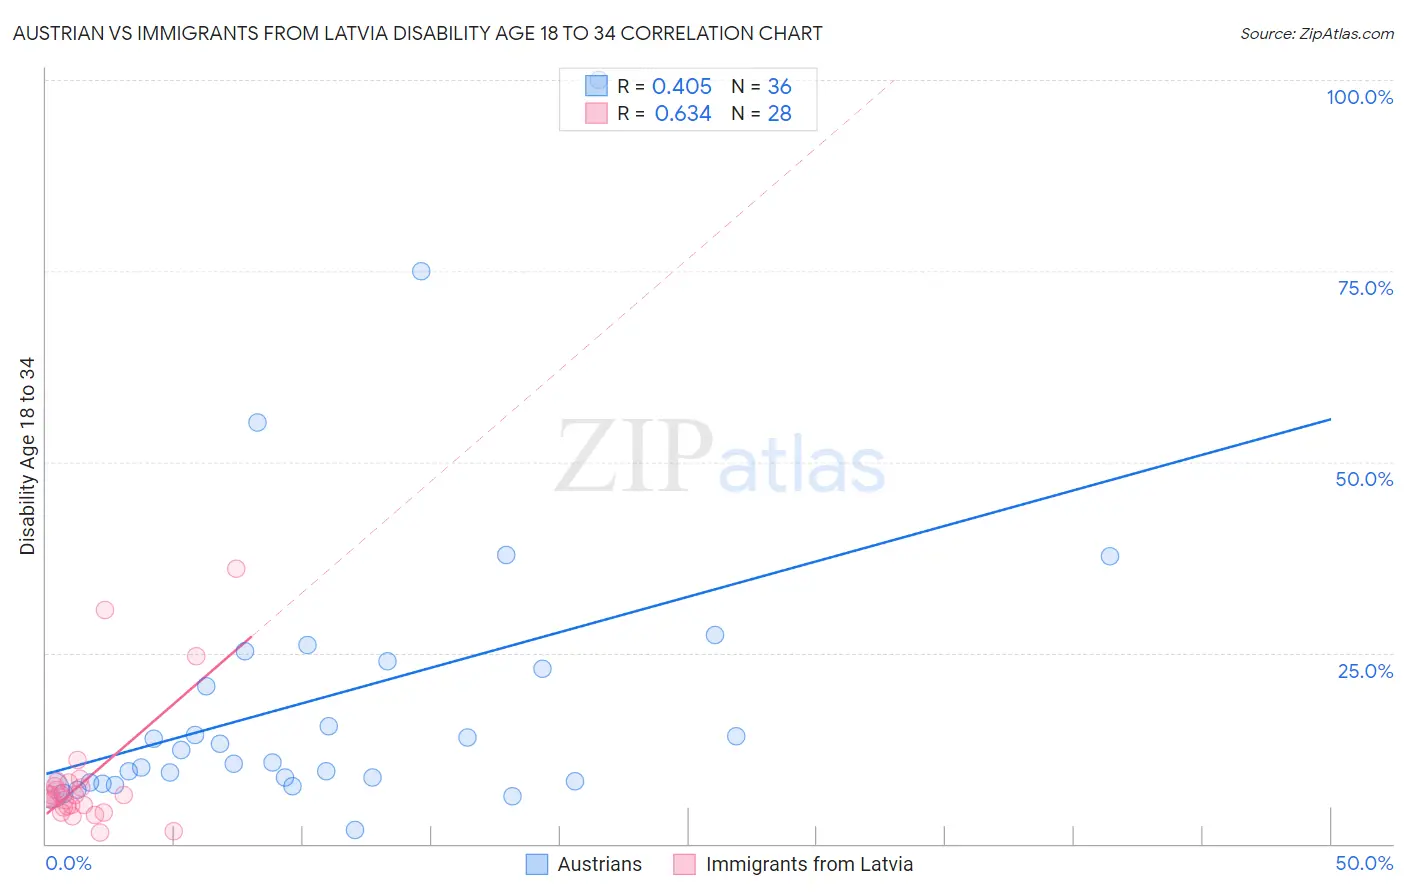
Austrian vs Immigrants from Latvia Disability Age 18 to 34 Correlation Chart
The statistical analysis conducted on geographies consisting of 450,218,227 people shows a moderate positive correlation between the proportion of Austrians and percentage of population with a disability between the ages 18 and 35 in the United States with a correlation coefficient (R) of 0.405 and weighted average of 7.1%. Similarly, the statistical analysis conducted on geographies consisting of 113,671,079 people shows a significant positive correlation between the proportion of Immigrants from Latvia and percentage of population with a disability between the ages 18 and 35 in the United States with a correlation coefficient (R) of 0.634 and weighted average of 6.4%, a difference of 11.0%.
Disability Age 18 to 34 Correlation Summary
| Measurement | Austrian | Immigrants from Latvia |
| Minimum | 1.7% | 1.5% |
| Maximum | 100.0% | 36.1% |
| Range | 98.3% | 34.6% |
| Mean | 19.3% | 8.5% |
| Median | 11.5% | 6.3% |
| Interquartile 25% (IQ1) | 8.1% | 4.8% |
| Interquartile 75% (IQ3) | 23.4% | 7.8% |
| Interquartile Range (IQR) | 15.4% | 3.0% |
| Standard Deviation (Sample) | 20.2% | 8.2% |
| Standard Deviation (Population) | 20.0% | 8.0% |
Similar Demographics by Disability Age 18 to 34
Demographics Similar to Austrians by Disability Age 18 to 34
In terms of disability age 18 to 34, the demographic groups most similar to Austrians are Marshallese (7.1%, a difference of 0.050%), Italian (7.1%, a difference of 0.16%), Liberian (7.1%, a difference of 0.17%), Arapaho (7.1%, a difference of 0.28%), and Nepalese (7.1%, a difference of 0.28%).
| Demographics | Rating | Rank | Disability Age 18 to 34 |
| Immigrants | North America | 3.9 /100 | #230 | Tragic 7.0% |
| Ute | 3.8 /100 | #231 | Tragic 7.0% |
| Samoans | 3.2 /100 | #232 | Tragic 7.0% |
| New Zealanders | 2.7 /100 | #233 | Tragic 7.0% |
| Alsatians | 2.1 /100 | #234 | Tragic 7.0% |
| Sub-Saharan Africans | 1.7 /100 | #235 | Tragic 7.1% |
| Liberians | 1.5 /100 | #236 | Tragic 7.1% |
| Austrians | 1.3 /100 | #237 | Tragic 7.1% |
| Marshallese | 1.3 /100 | #238 | Tragic 7.1% |
| Italians | 1.2 /100 | #239 | Tragic 7.1% |
| Arapaho | 1.1 /100 | #240 | Tragic 7.1% |
| Nepalese | 1.1 /100 | #241 | Tragic 7.1% |
| Immigrants | Congo | 1.1 /100 | #242 | Tragic 7.1% |
| Icelanders | 1.0 /100 | #243 | Tragic 7.1% |
| Immigrants | Zaire | 0.9 /100 | #244 | Tragic 7.1% |
Demographics Similar to Immigrants from Latvia by Disability Age 18 to 34
In terms of disability age 18 to 34, the demographic groups most similar to Immigrants from Latvia are South American Indian (6.4%, a difference of 0.020%), Jamaican (6.4%, a difference of 0.050%), Immigrants from Fiji (6.4%, a difference of 0.14%), Immigrants from Belize (6.4%, a difference of 0.16%), and Albanian (6.4%, a difference of 0.17%).
| Demographics | Rating | Rank | Disability Age 18 to 34 |
| Immigrants | Sweden | 88.5 /100 | #136 | Excellent 6.4% |
| Immigrants | Honduras | 87.7 /100 | #137 | Excellent 6.4% |
| Spanish American Indians | 87.7 /100 | #138 | Excellent 6.4% |
| Immigrants | Belize | 87.4 /100 | #139 | Excellent 6.4% |
| Immigrants | Fiji | 87.3 /100 | #140 | Excellent 6.4% |
| Jamaicans | 86.8 /100 | #141 | Excellent 6.4% |
| South American Indians | 86.5 /100 | #142 | Excellent 6.4% |
| Immigrants | Latvia | 86.4 /100 | #143 | Excellent 6.4% |
| Albanians | 85.3 /100 | #144 | Excellent 6.4% |
| Moroccans | 85.2 /100 | #145 | Excellent 6.4% |
| Belizeans | 84.9 /100 | #146 | Excellent 6.4% |
| Immigrants | South Africa | 83.7 /100 | #147 | Excellent 6.4% |
| Immigrants | Belgium | 83.5 /100 | #148 | Excellent 6.4% |
| Hondurans | 83.1 /100 | #149 | Excellent 6.4% |
| Immigrants | Dominican Republic | 82.7 /100 | #150 | Excellent 6.4% |