Austrian vs Pueblo Disability Age Under 5
COMPARE
Austrian
Pueblo
Disability Age Under 5
Disability Age Under 5 Comparison
Austrians
Pueblo
1.4%
DISABILITY AGE UNDER 5
0.1/ 100
METRIC RATING
269th/ 347
METRIC RANK
1.3%
DISABILITY AGE UNDER 5
3.8/ 100
METRIC RATING
234th/ 347
METRIC RANK
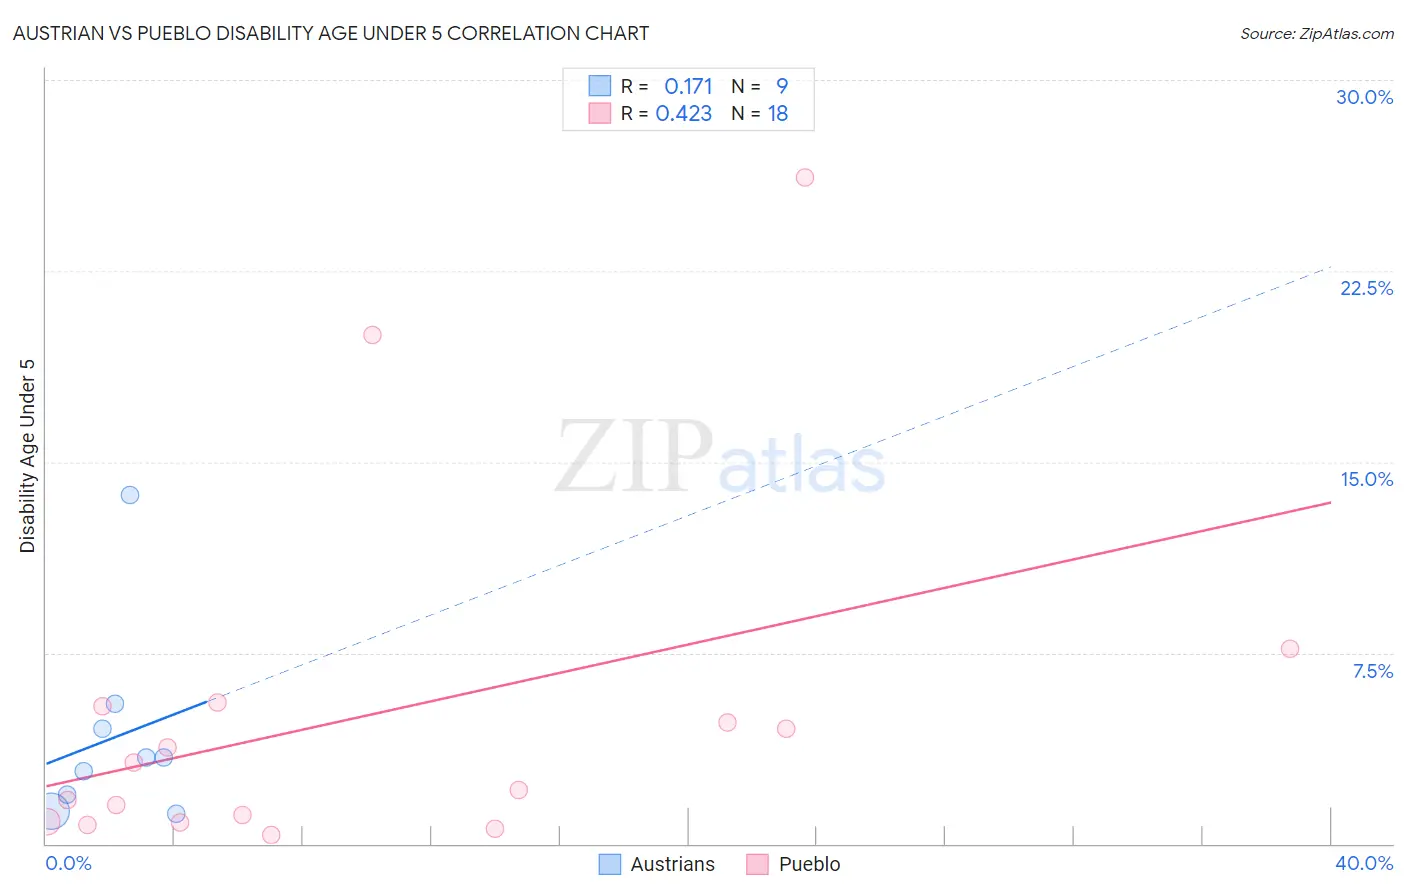
Austrian vs Pueblo Disability Age Under 5 Correlation Chart
The statistical analysis conducted on geographies consisting of 227,811,367 people shows a poor positive correlation between the proportion of Austrians and percentage of population with a disability under the age of 5 in the United States with a correlation coefficient (R) of 0.171 and weighted average of 1.4%. Similarly, the statistical analysis conducted on geographies consisting of 91,796,516 people shows a moderate positive correlation between the proportion of Pueblo and percentage of population with a disability under the age of 5 in the United States with a correlation coefficient (R) of 0.423 and weighted average of 1.3%, a difference of 8.3%.
Disability Age Under 5 Correlation Summary
| Measurement | Austrian | Pueblo |
| Minimum | 1.2% | 0.37% |
| Maximum | 13.7% | 26.2% |
| Range | 12.5% | 25.8% |
| Mean | 4.2% | 5.1% |
| Median | 3.4% | 2.7% |
| Interquartile 25% (IQ1) | 1.6% | 0.86% |
| Interquartile 75% (IQ3) | 5.0% | 5.4% |
| Interquartile Range (IQR) | 3.4% | 4.5% |
| Standard Deviation (Sample) | 3.8% | 7.0% |
| Standard Deviation (Population) | 3.6% | 6.8% |
Similar Demographics by Disability Age Under 5
Demographics Similar to Austrians by Disability Age Under 5
In terms of disability age under 5, the demographic groups most similar to Austrians are Immigrants from North America (1.4%, a difference of 0.13%), Immigrants from Canada (1.4%, a difference of 0.17%), Belgian (1.4%, a difference of 0.18%), Black/African American (1.4%, a difference of 0.33%), and Alaskan Athabascan (1.5%, a difference of 0.63%).
| Demographics | Rating | Rank | Disability Age Under 5 |
| Immigrants | Dominica | 0.2 /100 | #262 | Tragic 1.4% |
| Spanish | 0.2 /100 | #263 | Tragic 1.4% |
| Yugoslavians | 0.1 /100 | #264 | Tragic 1.4% |
| Carpatho Rusyns | 0.1 /100 | #265 | Tragic 1.4% |
| Immigrants | Germany | 0.1 /100 | #266 | Tragic 1.4% |
| Cree | 0.1 /100 | #267 | Tragic 1.4% |
| Belgians | 0.1 /100 | #268 | Tragic 1.4% |
| Austrians | 0.1 /100 | #269 | Tragic 1.4% |
| Immigrants | North America | 0.1 /100 | #270 | Tragic 1.4% |
| Immigrants | Canada | 0.1 /100 | #271 | Tragic 1.4% |
| Blacks/African Americans | 0.1 /100 | #272 | Tragic 1.4% |
| Alaskan Athabascans | 0.1 /100 | #273 | Tragic 1.5% |
| Iroquois | 0.0 /100 | #274 | Tragic 1.5% |
| Brazilians | 0.0 /100 | #275 | Tragic 1.5% |
| Greeks | 0.0 /100 | #276 | Tragic 1.5% |
Demographics Similar to Pueblo by Disability Age Under 5
In terms of disability age under 5, the demographic groups most similar to Pueblo are Central American Indian (1.3%, a difference of 0.070%), Tongan (1.3%, a difference of 0.26%), South American Indian (1.3%, a difference of 0.27%), French American Indian (1.3%, a difference of 0.38%), and Immigrants from Northern Europe (1.3%, a difference of 0.51%).
| Demographics | Rating | Rank | Disability Age Under 5 |
| Taiwanese | 6.1 /100 | #227 | Tragic 1.3% |
| Luxembourgers | 6.1 /100 | #228 | Tragic 1.3% |
| Immigrants | Costa Rica | 5.5 /100 | #229 | Tragic 1.3% |
| Lebanese | 5.3 /100 | #230 | Tragic 1.3% |
| Immigrants | Northern Europe | 4.7 /100 | #231 | Tragic 1.3% |
| French American Indians | 4.5 /100 | #232 | Tragic 1.3% |
| Tongans | 4.2 /100 | #233 | Tragic 1.3% |
| Pueblo | 3.8 /100 | #234 | Tragic 1.3% |
| Central American Indians | 3.6 /100 | #235 | Tragic 1.3% |
| South American Indians | 3.3 /100 | #236 | Tragic 1.3% |
| Basques | 3.0 /100 | #237 | Tragic 1.3% |
| Spanish American Indians | 2.4 /100 | #238 | Tragic 1.3% |
| Immigrants | Austria | 2.3 /100 | #239 | Tragic 1.3% |
| Native Hawaiians | 2.2 /100 | #240 | Tragic 1.3% |
| Maltese | 2.2 /100 | #241 | Tragic 1.3% |