Australian vs Immigrants from North Macedonia Vision Disability
COMPARE
Australian
Immigrants from North Macedonia
Vision Disability
Vision Disability Comparison
Australians
Immigrants from North Macedonia
2.1%
VISION DISABILITY
95.9/ 100
METRIC RATING
95th/ 347
METRIC RANK
2.0%
VISION DISABILITY
98.3/ 100
METRIC RATING
75th/ 347
METRIC RANK
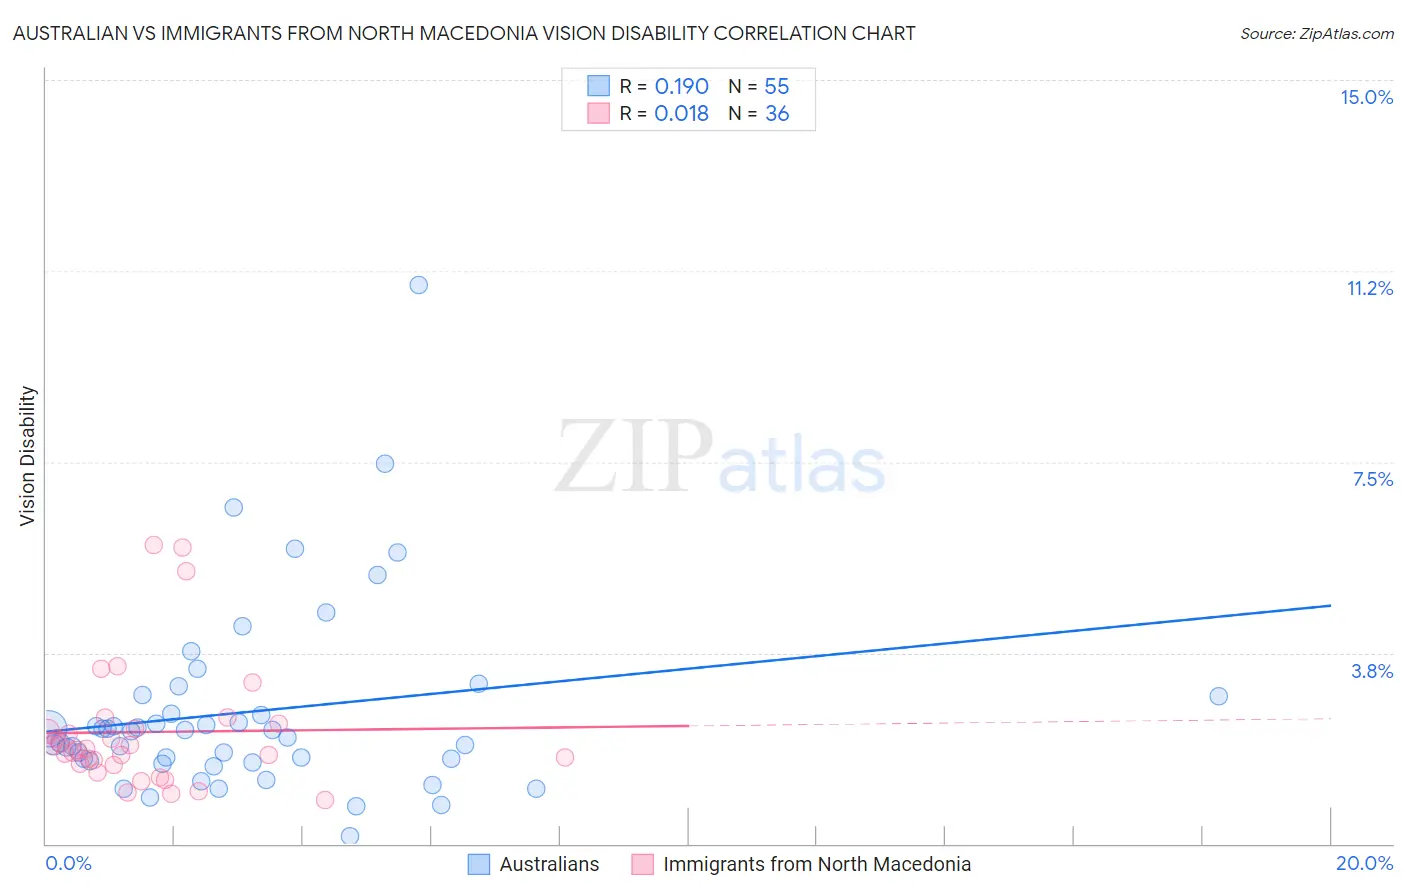
Australian vs Immigrants from North Macedonia Vision Disability Correlation Chart
The statistical analysis conducted on geographies consisting of 224,056,870 people shows a poor positive correlation between the proportion of Australians and percentage of population with vision disability in the United States with a correlation coefficient (R) of 0.190 and weighted average of 2.1%. Similarly, the statistical analysis conducted on geographies consisting of 74,311,992 people shows no correlation between the proportion of Immigrants from North Macedonia and percentage of population with vision disability in the United States with a correlation coefficient (R) of 0.018 and weighted average of 2.0%, a difference of 1.5%.
Vision Disability Correlation Summary
| Measurement | Australian | Immigrants from North Macedonia |
| Minimum | 0.16% | 0.85% |
| Maximum | 11.0% | 5.9% |
| Range | 10.8% | 5.0% |
| Mean | 2.6% | 2.2% |
| Median | 2.2% | 1.9% |
| Interquartile 25% (IQ1) | 1.6% | 1.6% |
| Interquartile 75% (IQ3) | 2.9% | 2.3% |
| Interquartile Range (IQR) | 1.3% | 0.75% |
| Standard Deviation (Sample) | 1.9% | 1.2% |
| Standard Deviation (Population) | 1.8% | 1.2% |
Demographics Similar to Australians and Immigrants from North Macedonia by Vision Disability
In terms of vision disability, the demographic groups most similar to Australians are Immigrants from Croatia (2.1%, a difference of 0.070%), Immigrants from Europe (2.1%, a difference of 0.090%), Immigrants from Syria (2.1%, a difference of 0.14%), Immigrants from Somalia (2.1%, a difference of 0.16%), and Immigrants from Lebanon (2.1%, a difference of 0.38%). Similarly, the demographic groups most similar to Immigrants from North Macedonia are Paraguayan (2.0%, a difference of 0.020%), Immigrants from Jordan (2.0%, a difference of 0.020%), Immigrants from Eastern Europe (2.0%, a difference of 0.050%), Assyrian/Chaldean/Syriac (2.0%, a difference of 0.23%), and Lithuanian (2.0%, a difference of 0.52%).
| Demographics | Rating | Rank | Vision Disability |
| Immigrants | North Macedonia | 98.3 /100 | #75 | Exceptional 2.0% |
| Paraguayans | 98.3 /100 | #76 | Exceptional 2.0% |
| Immigrants | Jordan | 98.3 /100 | #77 | Exceptional 2.0% |
| Immigrants | Eastern Europe | 98.3 /100 | #78 | Exceptional 2.0% |
| Assyrians/Chaldeans/Syriacs | 98.1 /100 | #79 | Exceptional 2.0% |
| Lithuanians | 97.7 /100 | #80 | Exceptional 2.0% |
| Soviet Union | 97.6 /100 | #81 | Exceptional 2.0% |
| Immigrants | Poland | 97.6 /100 | #82 | Exceptional 2.0% |
| Immigrants | Western Asia | 97.5 /100 | #83 | Exceptional 2.0% |
| Immigrants | Latvia | 97.3 /100 | #84 | Exceptional 2.0% |
| Chinese | 97.2 /100 | #85 | Exceptional 2.0% |
| Immigrants | Moldova | 97.2 /100 | #86 | Exceptional 2.0% |
| Immigrants | Switzerland | 97.0 /100 | #87 | Exceptional 2.0% |
| Norwegians | 97.0 /100 | #88 | Exceptional 2.0% |
| Immigrants | Eastern Africa | 97.0 /100 | #89 | Exceptional 2.0% |
| Immigrants | Lebanon | 96.7 /100 | #90 | Exceptional 2.1% |
| Immigrants | Somalia | 96.2 /100 | #91 | Exceptional 2.1% |
| Immigrants | Syria | 96.2 /100 | #92 | Exceptional 2.1% |
| Immigrants | Europe | 96.1 /100 | #93 | Exceptional 2.1% |
| Immigrants | Croatia | 96.0 /100 | #94 | Exceptional 2.1% |
| Australians | 95.9 /100 | #95 | Exceptional 2.1% |