Paraguayan vs Immigrants from Haiti Female Disability
COMPARE
Paraguayan
Immigrants from Haiti
Female Disability
Female Disability Comparison
Paraguayans
Immigrants from Haiti
11.2%
FEMALE DISABILITY
100.0/ 100
METRIC RATING
41st/ 347
METRIC RANK
12.2%
FEMALE DISABILITY
58.8/ 100
METRIC RATING
168th/ 347
METRIC RANK
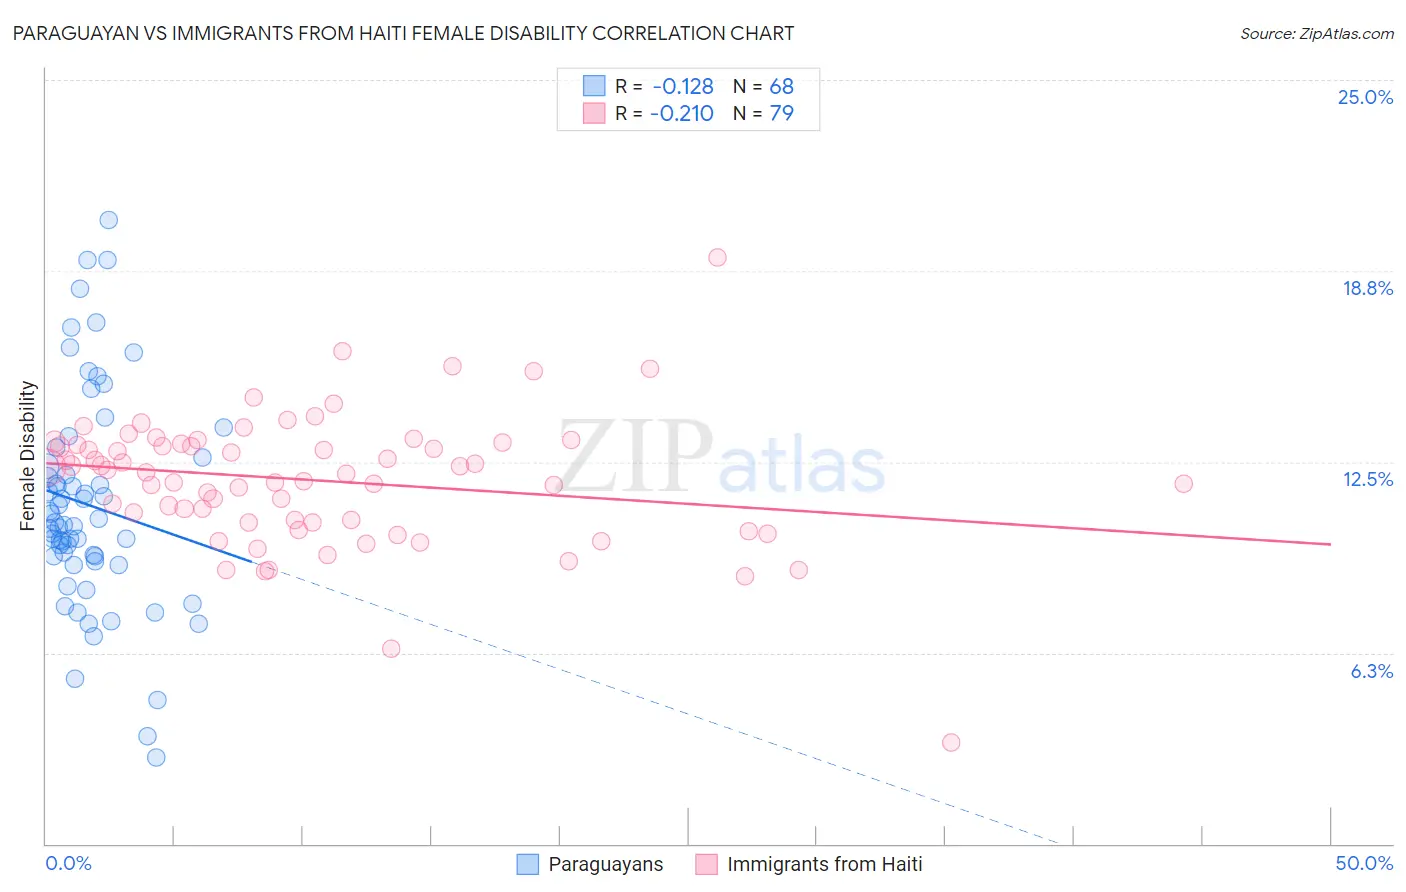
Paraguayan vs Immigrants from Haiti Female Disability Correlation Chart
The statistical analysis conducted on geographies consisting of 95,112,364 people shows a poor negative correlation between the proportion of Paraguayans and percentage of females with a disability in the United States with a correlation coefficient (R) of -0.128 and weighted average of 11.2%. Similarly, the statistical analysis conducted on geographies consisting of 225,238,794 people shows a weak negative correlation between the proportion of Immigrants from Haiti and percentage of females with a disability in the United States with a correlation coefficient (R) of -0.210 and weighted average of 12.2%, a difference of 8.3%.
Female Disability Correlation Summary
| Measurement | Paraguayan | Immigrants from Haiti |
| Minimum | 2.8% | 3.3% |
| Maximum | 20.4% | 19.2% |
| Range | 17.6% | 15.9% |
| Mean | 11.1% | 11.9% |
| Median | 10.5% | 12.1% |
| Interquartile 25% (IQ1) | 9.3% | 10.5% |
| Interquartile 75% (IQ3) | 12.5% | 13.1% |
| Interquartile Range (IQR) | 3.2% | 2.6% |
| Standard Deviation (Sample) | 3.5% | 2.2% |
| Standard Deviation (Population) | 3.5% | 2.2% |
Similar Demographics by Female Disability
Demographics Similar to Paraguayans by Female Disability
In terms of female disability, the demographic groups most similar to Paraguayans are Mongolian (11.2%, a difference of 0.020%), Immigrants from Lithuania (11.2%, a difference of 0.050%), Israeli (11.2%, a difference of 0.10%), Afghan (11.2%, a difference of 0.12%), and Immigrants from Ethiopia (11.2%, a difference of 0.26%).
| Demographics | Rating | Rank | Female Disability |
| Immigrants | Indonesia | 100.0 /100 | #34 | Exceptional 11.2% |
| Immigrants | Japan | 100.0 /100 | #35 | Exceptional 11.2% |
| Cypriots | 100.0 /100 | #36 | Exceptional 11.2% |
| Ethiopians | 100.0 /100 | #37 | Exceptional 11.2% |
| Immigrants | Ethiopia | 100.0 /100 | #38 | Exceptional 11.2% |
| Immigrants | Lithuania | 100.0 /100 | #39 | Exceptional 11.2% |
| Mongolians | 100.0 /100 | #40 | Exceptional 11.2% |
| Paraguayans | 100.0 /100 | #41 | Exceptional 11.2% |
| Israelis | 100.0 /100 | #42 | Exceptional 11.2% |
| Afghans | 100.0 /100 | #43 | Exceptional 11.2% |
| Cambodians | 100.0 /100 | #44 | Exceptional 11.3% |
| Immigrants | Sweden | 100.0 /100 | #45 | Exceptional 11.3% |
| Immigrants | Nepal | 100.0 /100 | #46 | Exceptional 11.3% |
| Jordanians | 100.0 /100 | #47 | Exceptional 11.3% |
| Zimbabweans | 100.0 /100 | #48 | Exceptional 11.3% |
Demographics Similar to Immigrants from Haiti by Female Disability
In terms of female disability, the demographic groups most similar to Immigrants from Haiti are Immigrants from Latin America (12.2%, a difference of 0.010%), Lithuanian (12.2%, a difference of 0.030%), Lebanese (12.2%, a difference of 0.030%), Maltese (12.2%, a difference of 0.070%), and Immigrants from Southern Europe (12.2%, a difference of 0.10%).
| Demographics | Rating | Rank | Female Disability |
| Guyanese | 64.7 /100 | #161 | Good 12.1% |
| Immigrants | Ukraine | 64.3 /100 | #162 | Good 12.1% |
| Guatemalans | 63.8 /100 | #163 | Good 12.1% |
| Czechs | 63.6 /100 | #164 | Good 12.1% |
| Immigrants | Oceania | 61.8 /100 | #165 | Good 12.1% |
| Lithuanians | 59.5 /100 | #166 | Average 12.2% |
| Immigrants | Latin America | 59.0 /100 | #167 | Average 12.2% |
| Immigrants | Haiti | 58.8 /100 | #168 | Average 12.2% |
| Lebanese | 58.1 /100 | #169 | Average 12.2% |
| Maltese | 57.0 /100 | #170 | Average 12.2% |
| Immigrants | Southern Europe | 56.3 /100 | #171 | Average 12.2% |
| Haitians | 51.9 /100 | #172 | Average 12.2% |
| Immigrants | Mexico | 50.8 /100 | #173 | Average 12.2% |
| Immigrants | England | 50.0 /100 | #174 | Average 12.2% |
| Immigrants | St. Vincent and the Grenadines | 49.7 /100 | #175 | Average 12.2% |