Australian vs Immigrants from Haiti Unemployment Among Women with Children Ages 6 to 17 years
COMPARE
Australian
Immigrants from Haiti
Unemployment Among Women with Children Ages 6 to 17 years
Unemployment Among Women with Children Ages 6 to 17 years Comparison
Australians
Immigrants from Haiti
8.5%
UNEMPLOYMENT AMONG WOMEN WITH CHILDREN AGES 6 TO 17 YEARS
98.9/ 100
METRIC RATING
93rd/ 347
METRIC RANK
10.1%
UNEMPLOYMENT AMONG WOMEN WITH CHILDREN AGES 6 TO 17 YEARS
0.0/ 100
METRIC RATING
298th/ 347
METRIC RANK
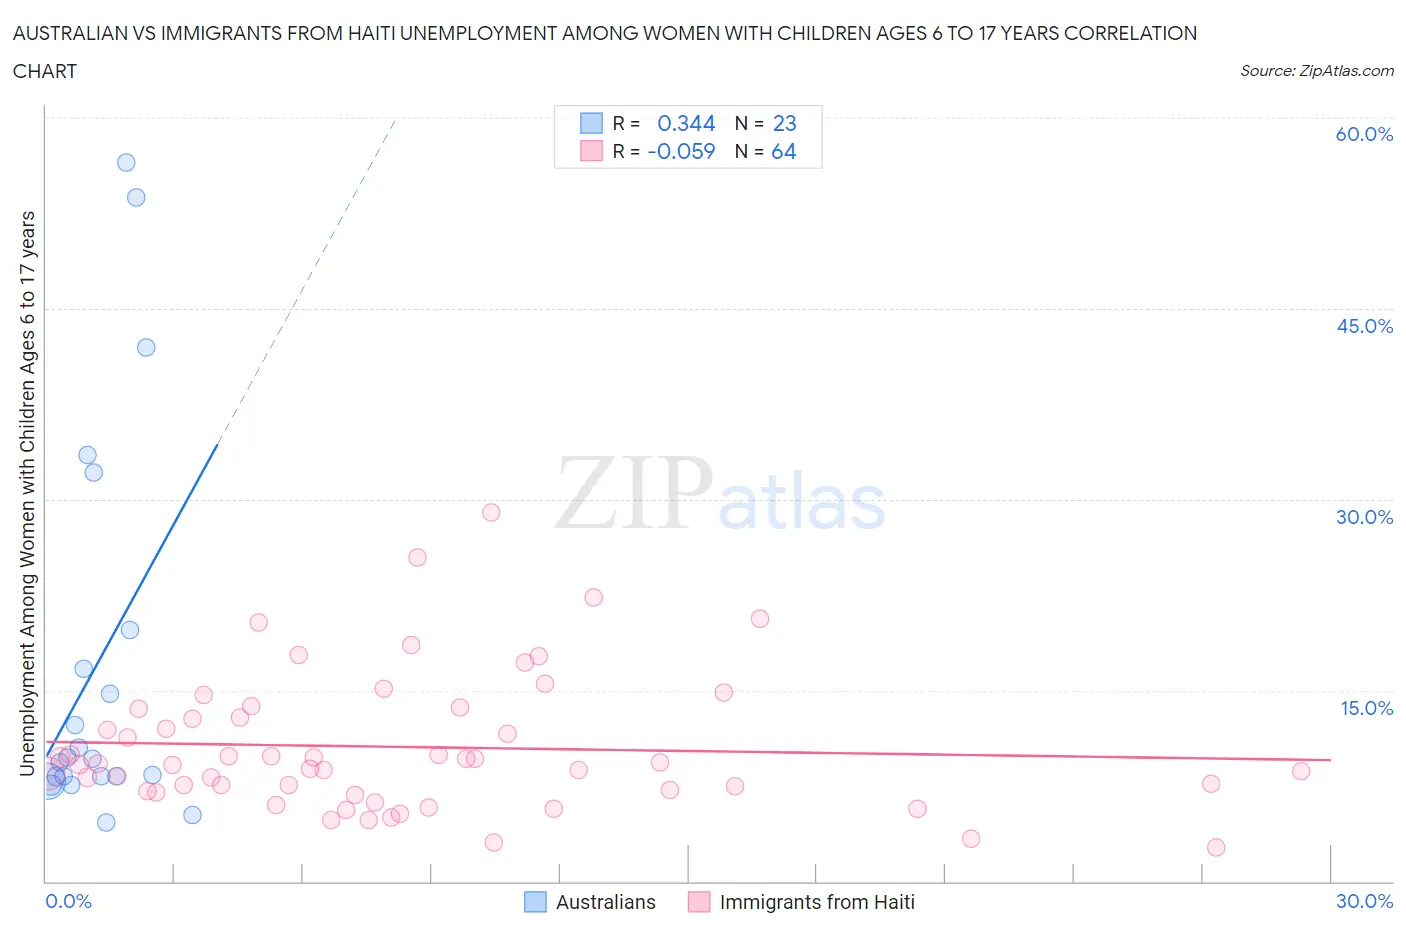
Australian vs Immigrants from Haiti Unemployment Among Women with Children Ages 6 to 17 years Correlation Chart
The statistical analysis conducted on geographies consisting of 174,001,217 people shows a mild positive correlation between the proportion of Australians and unemployment rate among women with children between the ages 6 and 17 in the United States with a correlation coefficient (R) of 0.344 and weighted average of 8.5%. Similarly, the statistical analysis conducted on geographies consisting of 177,744,488 people shows a slight negative correlation between the proportion of Immigrants from Haiti and unemployment rate among women with children between the ages 6 and 17 in the United States with a correlation coefficient (R) of -0.059 and weighted average of 10.1%, a difference of 18.5%.
Unemployment Among Women with Children Ages 6 to 17 years Correlation Summary
| Measurement | Australian | Immigrants from Haiti |
| Minimum | 4.6% | 2.7% |
| Maximum | 56.5% | 29.0% |
| Range | 51.9% | 26.3% |
| Mean | 17.1% | 10.6% |
| Median | 9.6% | 9.2% |
| Interquartile 25% (IQ1) | 8.2% | 7.1% |
| Interquartile 75% (IQ3) | 19.7% | 13.2% |
| Interquartile Range (IQR) | 11.5% | 6.1% |
| Standard Deviation (Sample) | 15.4% | 5.4% |
| Standard Deviation (Population) | 15.0% | 5.3% |
Similar Demographics by Unemployment Among Women with Children Ages 6 to 17 years
Demographics Similar to Australians by Unemployment Among Women with Children Ages 6 to 17 years
In terms of unemployment among women with children ages 6 to 17 years, the demographic groups most similar to Australians are Immigrants from Barbados (8.5%, a difference of 0.11%), Potawatomi (8.5%, a difference of 0.12%), Immigrants from Eastern Europe (8.5%, a difference of 0.14%), Sri Lankan (8.5%, a difference of 0.16%), and Yugoslavian (8.5%, a difference of 0.21%).
| Demographics | Rating | Rank | Unemployment Among Women with Children Ages 6 to 17 years |
| Alaskan Athabascans | 99.4 /100 | #86 | Exceptional 8.5% |
| Immigrants | Israel | 99.1 /100 | #87 | Exceptional 8.5% |
| Immigrants | Vietnam | 99.1 /100 | #88 | Exceptional 8.5% |
| Paiute | 99.1 /100 | #89 | Exceptional 8.5% |
| Yugoslavians | 99.0 /100 | #90 | Exceptional 8.5% |
| Immigrants | Eastern Europe | 99.0 /100 | #91 | Exceptional 8.5% |
| Potawatomi | 99.0 /100 | #92 | Exceptional 8.5% |
| Australians | 98.9 /100 | #93 | Exceptional 8.5% |
| Immigrants | Barbados | 98.8 /100 | #94 | Exceptional 8.5% |
| Sri Lankans | 98.7 /100 | #95 | Exceptional 8.5% |
| German Russians | 98.6 /100 | #96 | Exceptional 8.5% |
| Bolivians | 98.5 /100 | #97 | Exceptional 8.5% |
| Malaysians | 98.5 /100 | #98 | Exceptional 8.6% |
| Immigrants | Lithuania | 98.4 /100 | #99 | Exceptional 8.6% |
| New Zealanders | 98.4 /100 | #100 | Exceptional 8.6% |
Demographics Similar to Immigrants from Haiti by Unemployment Among Women with Children Ages 6 to 17 years
In terms of unemployment among women with children ages 6 to 17 years, the demographic groups most similar to Immigrants from Haiti are Immigrants from Honduras (10.1%, a difference of 0.020%), Nigerian (10.1%, a difference of 0.040%), Immigrants from Bahamas (10.1%, a difference of 0.20%), Immigrants from Caribbean (10.1%, a difference of 0.30%), and Immigrants from Western Africa (10.1%, a difference of 0.32%).
| Demographics | Rating | Rank | Unemployment Among Women with Children Ages 6 to 17 years |
| Immigrants | Nonimmigrants | 0.0 /100 | #291 | Tragic 10.0% |
| Carpatho Rusyns | 0.0 /100 | #292 | Tragic 10.0% |
| Haitians | 0.0 /100 | #293 | Tragic 10.0% |
| Ecuadorians | 0.0 /100 | #294 | Tragic 10.0% |
| Cherokee | 0.0 /100 | #295 | Tragic 10.0% |
| Immigrants | Western Africa | 0.0 /100 | #296 | Tragic 10.1% |
| Immigrants | Caribbean | 0.0 /100 | #297 | Tragic 10.1% |
| Immigrants | Haiti | 0.0 /100 | #298 | Tragic 10.1% |
| Immigrants | Honduras | 0.0 /100 | #299 | Tragic 10.1% |
| Nigerians | 0.0 /100 | #300 | Tragic 10.1% |
| Immigrants | Bahamas | 0.0 /100 | #301 | Tragic 10.1% |
| Venezuelans | 0.0 /100 | #302 | Tragic 10.2% |
| Immigrants | Ecuador | 0.0 /100 | #303 | Tragic 10.2% |
| Immigrants | Venezuela | 0.0 /100 | #304 | Tragic 10.2% |
| Immigrants | Nigeria | 0.0 /100 | #305 | Tragic 10.2% |