Pakistani vs Immigrants from Haiti Female Disability
COMPARE
Pakistani
Immigrants from Haiti
Female Disability
Female Disability Comparison
Pakistanis
Immigrants from Haiti
12.0%
FEMALE DISABILITY
84.6/ 100
METRIC RATING
146th/ 347
METRIC RANK
12.2%
FEMALE DISABILITY
58.8/ 100
METRIC RATING
168th/ 347
METRIC RANK
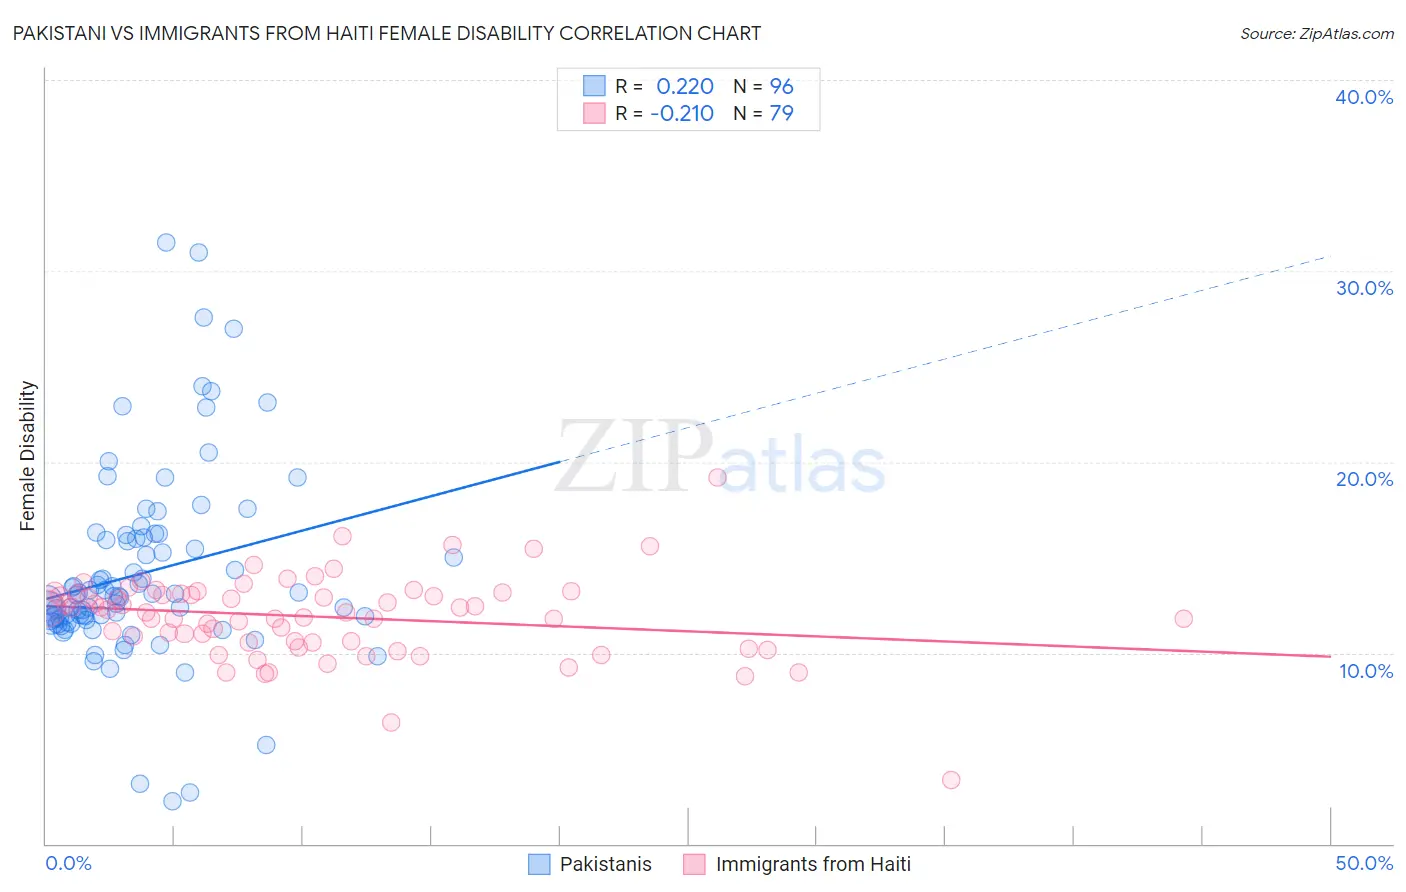
Pakistani vs Immigrants from Haiti Female Disability Correlation Chart
The statistical analysis conducted on geographies consisting of 335,294,894 people shows a weak positive correlation between the proportion of Pakistanis and percentage of females with a disability in the United States with a correlation coefficient (R) of 0.220 and weighted average of 12.0%. Similarly, the statistical analysis conducted on geographies consisting of 225,238,794 people shows a weak negative correlation between the proportion of Immigrants from Haiti and percentage of females with a disability in the United States with a correlation coefficient (R) of -0.210 and weighted average of 12.2%, a difference of 1.3%.
Female Disability Correlation Summary
| Measurement | Pakistani | Immigrants from Haiti |
| Minimum | 2.2% | 3.3% |
| Maximum | 31.5% | 19.2% |
| Range | 29.3% | 15.9% |
| Mean | 14.2% | 11.9% |
| Median | 13.0% | 12.1% |
| Interquartile 25% (IQ1) | 11.7% | 10.5% |
| Interquartile 75% (IQ3) | 16.0% | 13.1% |
| Interquartile Range (IQR) | 4.3% | 2.6% |
| Standard Deviation (Sample) | 5.0% | 2.2% |
| Standard Deviation (Population) | 5.0% | 2.2% |
Similar Demographics by Female Disability
Demographics Similar to Pakistanis by Female Disability
In terms of female disability, the demographic groups most similar to Pakistanis are Nigerian (12.0%, a difference of 0.040%), Immigrants from Kenya (12.0%, a difference of 0.11%), Greek (12.0%, a difference of 0.18%), Immigrants from Moldova (12.0%, a difference of 0.21%), and Estonian (12.0%, a difference of 0.26%).
| Demographics | Rating | Rank | Female Disability |
| Immigrants | Hungary | 92.8 /100 | #139 | Exceptional 11.9% |
| Romanians | 91.6 /100 | #140 | Exceptional 11.9% |
| Immigrants | Ecuador | 91.5 /100 | #141 | Exceptional 11.9% |
| Immigrants | Africa | 90.0 /100 | #142 | Excellent 11.9% |
| Immigrants | Sudan | 89.6 /100 | #143 | Excellent 11.9% |
| Immigrants | Austria | 87.9 /100 | #144 | Excellent 12.0% |
| Estonians | 87.8 /100 | #145 | Excellent 12.0% |
| Pakistanis | 84.6 /100 | #146 | Excellent 12.0% |
| Nigerians | 84.0 /100 | #147 | Excellent 12.0% |
| Immigrants | Kenya | 83.1 /100 | #148 | Excellent 12.0% |
| Greeks | 82.0 /100 | #149 | Excellent 12.0% |
| Immigrants | Moldova | 81.4 /100 | #150 | Excellent 12.0% |
| Icelanders | 80.7 /100 | #151 | Excellent 12.0% |
| Immigrants | Scotland | 79.3 /100 | #152 | Good 12.0% |
| Sudanese | 79.1 /100 | #153 | Good 12.0% |
Demographics Similar to Immigrants from Haiti by Female Disability
In terms of female disability, the demographic groups most similar to Immigrants from Haiti are Immigrants from Latin America (12.2%, a difference of 0.010%), Lithuanian (12.2%, a difference of 0.030%), Lebanese (12.2%, a difference of 0.030%), Maltese (12.2%, a difference of 0.070%), and Immigrants from Southern Europe (12.2%, a difference of 0.10%).
| Demographics | Rating | Rank | Female Disability |
| Guyanese | 64.7 /100 | #161 | Good 12.1% |
| Immigrants | Ukraine | 64.3 /100 | #162 | Good 12.1% |
| Guatemalans | 63.8 /100 | #163 | Good 12.1% |
| Czechs | 63.6 /100 | #164 | Good 12.1% |
| Immigrants | Oceania | 61.8 /100 | #165 | Good 12.1% |
| Lithuanians | 59.5 /100 | #166 | Average 12.2% |
| Immigrants | Latin America | 59.0 /100 | #167 | Average 12.2% |
| Immigrants | Haiti | 58.8 /100 | #168 | Average 12.2% |
| Lebanese | 58.1 /100 | #169 | Average 12.2% |
| Maltese | 57.0 /100 | #170 | Average 12.2% |
| Immigrants | Southern Europe | 56.3 /100 | #171 | Average 12.2% |
| Haitians | 51.9 /100 | #172 | Average 12.2% |
| Immigrants | Mexico | 50.8 /100 | #173 | Average 12.2% |
| Immigrants | England | 50.0 /100 | #174 | Average 12.2% |
| Immigrants | St. Vincent and the Grenadines | 49.7 /100 | #175 | Average 12.2% |