Immigrants from Dominica vs Tohono O'odham Disability Age 65 to 74
COMPARE
Immigrants from Dominica
Tohono O'odham
Disability Age 65 to 74
Disability Age 65 to 74 Comparison
Immigrants from Dominica
Tohono O'odham
25.7%
DISABILITY AGE 65 TO 74
0.1/ 100
METRIC RATING
272nd/ 347
METRIC RANK
36.0%
DISABILITY AGE 65 TO 74
0.0/ 100
METRIC RATING
345th/ 347
METRIC RANK
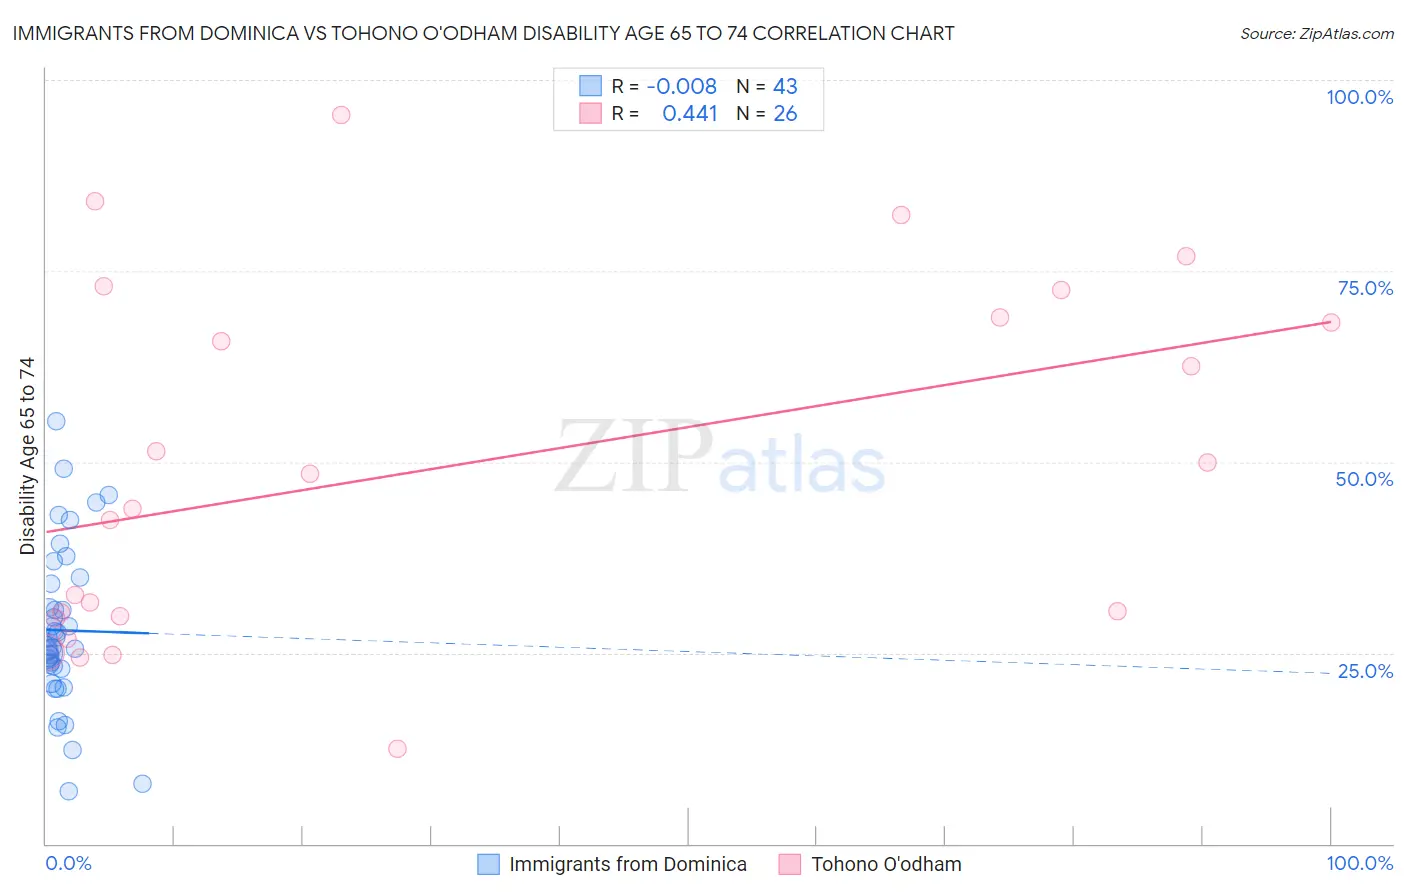
Immigrants from Dominica vs Tohono O'odham Disability Age 65 to 74 Correlation Chart
The statistical analysis conducted on geographies consisting of 83,763,598 people shows no correlation between the proportion of Immigrants from Dominica and percentage of population with a disability between the ages 65 and 75 in the United States with a correlation coefficient (R) of -0.008 and weighted average of 25.7%. Similarly, the statistical analysis conducted on geographies consisting of 58,691,657 people shows a moderate positive correlation between the proportion of Tohono O'odham and percentage of population with a disability between the ages 65 and 75 in the United States with a correlation coefficient (R) of 0.441 and weighted average of 36.0%, a difference of 40.3%.
Disability Age 65 to 74 Correlation Summary
| Measurement | Immigrants from Dominica | Tohono O'odham |
| Minimum | 6.9% | 12.4% |
| Maximum | 55.3% | 95.5% |
| Range | 48.4% | 83.1% |
| Mean | 27.9% | 49.4% |
| Median | 25.7% | 46.1% |
| Interquartile 25% (IQ1) | 22.9% | 29.8% |
| Interquartile 75% (IQ3) | 34.1% | 69.0% |
| Interquartile Range (IQR) | 11.3% | 39.1% |
| Standard Deviation (Sample) | 10.4% | 23.1% |
| Standard Deviation (Population) | 10.3% | 22.6% |
Similar Demographics by Disability Age 65 to 74
Demographics Similar to Immigrants from Dominica by Disability Age 65 to 74
In terms of disability age 65 to 74, the demographic groups most similar to Immigrants from Dominica are Immigrants from Liberia (25.7%, a difference of 0.0%), Immigrants from Guatemala (25.7%, a difference of 0.030%), Hmong (25.7%, a difference of 0.11%), Japanese (25.7%, a difference of 0.13%), and Liberian (25.6%, a difference of 0.23%).
| Demographics | Rating | Rank | Disability Age 65 to 74 |
| Guatemalans | 0.2 /100 | #265 | Tragic 25.5% |
| Immigrants | Latin America | 0.1 /100 | #266 | Tragic 25.6% |
| Ottawa | 0.1 /100 | #267 | Tragic 25.6% |
| Liberians | 0.1 /100 | #268 | Tragic 25.6% |
| Hmong | 0.1 /100 | #269 | Tragic 25.7% |
| Immigrants | Guatemala | 0.1 /100 | #270 | Tragic 25.7% |
| Immigrants | Liberia | 0.1 /100 | #271 | Tragic 25.7% |
| Immigrants | Dominica | 0.1 /100 | #272 | Tragic 25.7% |
| Japanese | 0.1 /100 | #273 | Tragic 25.7% |
| Americans | 0.1 /100 | #274 | Tragic 25.8% |
| Hondurans | 0.1 /100 | #275 | Tragic 25.8% |
| French American Indians | 0.1 /100 | #276 | Tragic 25.8% |
| Belizeans | 0.1 /100 | #277 | Tragic 25.8% |
| Immigrants | Belize | 0.1 /100 | #278 | Tragic 25.8% |
| U.S. Virgin Islanders | 0.1 /100 | #279 | Tragic 25.9% |
Demographics Similar to Tohono O'odham by Disability Age 65 to 74
In terms of disability age 65 to 74, the demographic groups most similar to Tohono O'odham are Inupiat (34.5%, a difference of 4.3%), Yup'ik (37.8%, a difference of 5.0%), Pima (38.6%, a difference of 7.1%), Navajo (33.3%, a difference of 8.1%), and Pueblo (33.1%, a difference of 8.9%).
| Demographics | Rating | Rank | Disability Age 65 to 74 |
| Colville | 0.0 /100 | #333 | Tragic 30.5% |
| Alaska Natives | 0.0 /100 | #334 | Tragic 30.6% |
| Cheyenne | 0.0 /100 | #335 | Tragic 31.1% |
| Yuman | 0.0 /100 | #336 | Tragic 31.5% |
| Houma | 0.0 /100 | #337 | Tragic 32.3% |
| Alaskan Athabascans | 0.0 /100 | #338 | Tragic 32.4% |
| Kiowa | 0.0 /100 | #339 | Tragic 32.6% |
| Lumbee | 0.0 /100 | #340 | Tragic 32.7% |
| Tsimshian | 0.0 /100 | #341 | Tragic 32.9% |
| Pueblo | 0.0 /100 | #342 | Tragic 33.1% |
| Navajo | 0.0 /100 | #343 | Tragic 33.3% |
| Inupiat | 0.0 /100 | #344 | Tragic 34.5% |
| Tohono O'odham | 0.0 /100 | #345 | Tragic 36.0% |
| Yup'ik | 0.0 /100 | #346 | Tragic 37.8% |
| Pima | 0.0 /100 | #347 | Tragic 38.6% |