Immigrants from Eastern Europe vs Immigrants from El Salvador Disability Age 35 to 64
COMPARE
Immigrants from Eastern Europe
Immigrants from El Salvador
Disability Age 35 to 64
Disability Age 35 to 64 Comparison
Immigrants from Eastern Europe
Immigrants from El Salvador
10.1%
DISABILITY AGE 35 TO 64
99.5/ 100
METRIC RATING
69th/ 347
METRIC RANK
10.7%
DISABILITY AGE 35 TO 64
92.8/ 100
METRIC RATING
131st/ 347
METRIC RANK
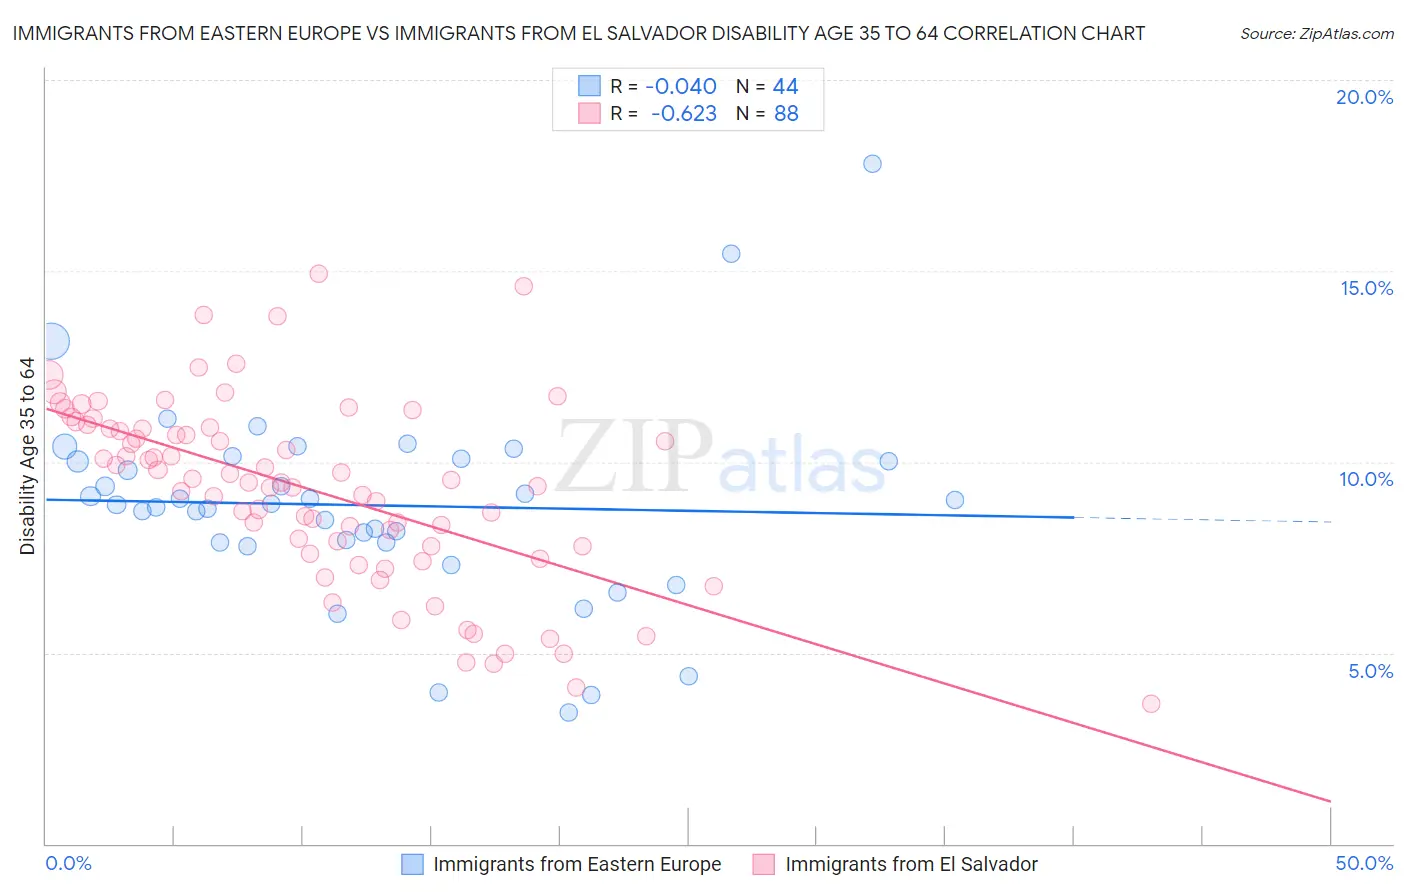
Immigrants from Eastern Europe vs Immigrants from El Salvador Disability Age 35 to 64 Correlation Chart
The statistical analysis conducted on geographies consisting of 475,376,812 people shows no correlation between the proportion of Immigrants from Eastern Europe and percentage of population with a disability between the ages 34 and 64 in the United States with a correlation coefficient (R) of -0.040 and weighted average of 10.1%. Similarly, the statistical analysis conducted on geographies consisting of 357,685,552 people shows a significant negative correlation between the proportion of Immigrants from El Salvador and percentage of population with a disability between the ages 34 and 64 in the United States with a correlation coefficient (R) of -0.623 and weighted average of 10.7%, a difference of 6.2%.
Disability Age 35 to 64 Correlation Summary
| Measurement | Immigrants from Eastern Europe | Immigrants from El Salvador |
| Minimum | 3.4% | 3.7% |
| Maximum | 17.8% | 14.9% |
| Range | 14.3% | 11.3% |
| Mean | 8.9% | 9.3% |
| Median | 8.9% | 9.5% |
| Interquartile 25% (IQ1) | 7.9% | 7.8% |
| Interquartile 75% (IQ3) | 10.0% | 10.9% |
| Interquartile Range (IQR) | 2.2% | 3.1% |
| Standard Deviation (Sample) | 2.6% | 2.4% |
| Standard Deviation (Population) | 2.6% | 2.4% |
Similar Demographics by Disability Age 35 to 64
Demographics Similar to Immigrants from Eastern Europe by Disability Age 35 to 64
In terms of disability age 35 to 64, the demographic groups most similar to Immigrants from Eastern Europe are Immigrants from Switzerland (10.1%, a difference of 0.020%), Immigrants from Nicaragua (10.1%, a difference of 0.020%), Immigrants from Kazakhstan (10.1%, a difference of 0.030%), Immigrants from Uzbekistan (10.1%, a difference of 0.12%), and Immigrants from Northern Europe (10.1%, a difference of 0.23%).
| Demographics | Rating | Rank | Disability Age 35 to 64 |
| Eastern Europeans | 99.7 /100 | #62 | Exceptional 10.0% |
| Immigrants | Czechoslovakia | 99.7 /100 | #63 | Exceptional 10.0% |
| Immigrants | Romania | 99.7 /100 | #64 | Exceptional 10.0% |
| Immigrants | Poland | 99.6 /100 | #65 | Exceptional 10.0% |
| Cubans | 99.6 /100 | #66 | Exceptional 10.0% |
| Immigrants | Uzbekistan | 99.5 /100 | #67 | Exceptional 10.1% |
| Immigrants | Switzerland | 99.5 /100 | #68 | Exceptional 10.1% |
| Immigrants | Eastern Europe | 99.5 /100 | #69 | Exceptional 10.1% |
| Immigrants | Nicaragua | 99.5 /100 | #70 | Exceptional 10.1% |
| Immigrants | Kazakhstan | 99.5 /100 | #71 | Exceptional 10.1% |
| Immigrants | Northern Europe | 99.5 /100 | #72 | Exceptional 10.1% |
| Immigrants | France | 99.5 /100 | #73 | Exceptional 10.1% |
| Laotians | 99.4 /100 | #74 | Exceptional 10.1% |
| Immigrants | Latvia | 99.4 /100 | #75 | Exceptional 10.1% |
| Immigrants | Chile | 99.4 /100 | #76 | Exceptional 10.1% |
Demographics Similar to Immigrants from El Salvador by Disability Age 35 to 64
In terms of disability age 35 to 64, the demographic groups most similar to Immigrants from El Salvador are Immigrants from Syria (10.7%, a difference of 0.050%), Ecuadorian (10.7%, a difference of 0.080%), Immigrants from Albania (10.7%, a difference of 0.11%), Immigrants (10.7%, a difference of 0.11%), and Immigrants from Ecuador (10.7%, a difference of 0.11%).
| Demographics | Rating | Rank | Disability Age 35 to 64 |
| Estonians | 94.5 /100 | #124 | Exceptional 10.6% |
| Albanians | 94.2 /100 | #125 | Exceptional 10.6% |
| Immigrants | Afghanistan | 94.1 /100 | #126 | Exceptional 10.6% |
| Immigrants | Zimbabwe | 94.0 /100 | #127 | Exceptional 10.6% |
| South Africans | 93.3 /100 | #128 | Exceptional 10.7% |
| Ecuadorians | 93.1 /100 | #129 | Exceptional 10.7% |
| Immigrants | Syria | 93.0 /100 | #130 | Exceptional 10.7% |
| Immigrants | El Salvador | 92.8 /100 | #131 | Exceptional 10.7% |
| Immigrants | Albania | 92.5 /100 | #132 | Exceptional 10.7% |
| Immigrants | Immigrants | 92.5 /100 | #133 | Exceptional 10.7% |
| Immigrants | Ecuador | 92.5 /100 | #134 | Exceptional 10.7% |
| Greeks | 92.3 /100 | #135 | Exceptional 10.7% |
| Salvadorans | 91.9 /100 | #136 | Exceptional 10.7% |
| Immigrants | Costa Rica | 91.7 /100 | #137 | Exceptional 10.7% |
| Immigrants | Southern Europe | 91.5 /100 | #138 | Exceptional 10.7% |