Lebanese vs Alsatian Disability Age 65 to 74
COMPARE
Lebanese
Alsatian
Disability Age 65 to 74
Disability Age 65 to 74 Comparison
Lebanese
Alsatians
22.5%
DISABILITY AGE 65 TO 74
92.2/ 100
METRIC RATING
126th/ 347
METRIC RANK
22.8%
DISABILITY AGE 65 TO 74
83.7/ 100
METRIC RATING
146th/ 347
METRIC RANK
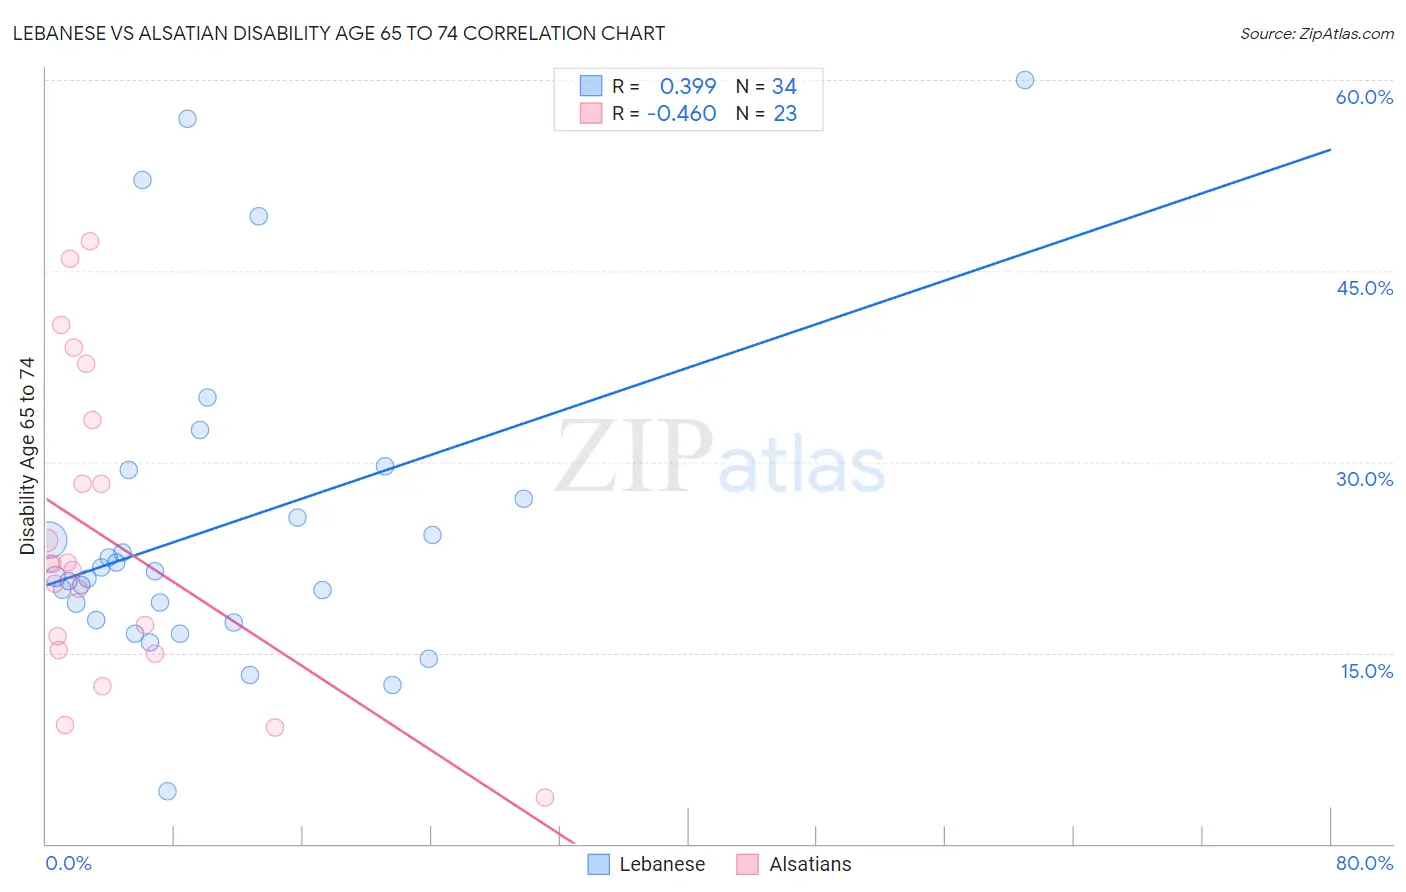
Lebanese vs Alsatian Disability Age 65 to 74 Correlation Chart
The statistical analysis conducted on geographies consisting of 400,836,048 people shows a mild positive correlation between the proportion of Lebanese and percentage of population with a disability between the ages 65 and 75 in the United States with a correlation coefficient (R) of 0.399 and weighted average of 22.5%. Similarly, the statistical analysis conducted on geographies consisting of 82,675,825 people shows a moderate negative correlation between the proportion of Alsatians and percentage of population with a disability between the ages 65 and 75 in the United States with a correlation coefficient (R) of -0.460 and weighted average of 22.8%, a difference of 1.3%.
Disability Age 65 to 74 Correlation Summary
| Measurement | Lebanese | Alsatian |
| Minimum | 4.1% | 3.7% |
| Maximum | 60.0% | 47.3% |
| Range | 55.9% | 43.7% |
| Mean | 24.9% | 23.9% |
| Median | 21.2% | 22.0% |
| Interquartile 25% (IQ1) | 17.6% | 15.2% |
| Interquartile 75% (IQ3) | 27.1% | 33.3% |
| Interquartile Range (IQR) | 9.5% | 18.2% |
| Standard Deviation (Sample) | 12.6% | 12.0% |
| Standard Deviation (Population) | 12.4% | 11.7% |
Demographics Similar to Lebanese and Alsatians by Disability Age 65 to 74
In terms of disability age 65 to 74, the demographic groups most similar to Lebanese are Slovak (22.5%, a difference of 0.11%), Immigrants from Costa Rica (22.6%, a difference of 0.34%), Immigrants from Uruguay (22.6%, a difference of 0.40%), Immigrants from Albania (22.6%, a difference of 0.41%), and Immigrants from Nepal (22.6%, a difference of 0.50%). Similarly, the demographic groups most similar to Alsatians are Immigrants from Uganda (22.8%, a difference of 0.030%), Danish (22.8%, a difference of 0.070%), Arab (22.8%, a difference of 0.12%), Immigrants from Ethiopia (22.7%, a difference of 0.18%), and Belgian (22.7%, a difference of 0.19%).
| Demographics | Rating | Rank | Disability Age 65 to 74 |
| Lebanese | 92.2 /100 | #126 | Exceptional 22.5% |
| Slovaks | 91.6 /100 | #127 | Exceptional 22.5% |
| Immigrants | Costa Rica | 90.4 /100 | #128 | Exceptional 22.6% |
| Immigrants | Uruguay | 90.1 /100 | #129 | Exceptional 22.6% |
| Immigrants | Albania | 90.0 /100 | #130 | Excellent 22.6% |
| Immigrants | Nepal | 89.4 /100 | #131 | Excellent 22.6% |
| Costa Ricans | 89.2 /100 | #132 | Excellent 22.6% |
| Northern Europeans | 88.9 /100 | #133 | Excellent 22.6% |
| Afghans | 88.6 /100 | #134 | Excellent 22.6% |
| Immigrants | Ukraine | 88.4 /100 | #135 | Excellent 22.6% |
| Ethiopians | 87.9 /100 | #136 | Excellent 22.7% |
| Taiwanese | 87.6 /100 | #137 | Excellent 22.7% |
| Immigrants | Moldova | 87.3 /100 | #138 | Excellent 22.7% |
| Immigrants | Syria | 85.8 /100 | #139 | Excellent 22.7% |
| Ugandans | 85.4 /100 | #140 | Excellent 22.7% |
| Belgians | 85.3 /100 | #141 | Excellent 22.7% |
| Immigrants | Ethiopia | 85.3 /100 | #142 | Excellent 22.7% |
| Arabs | 84.8 /100 | #143 | Excellent 22.8% |
| Danes | 84.4 /100 | #144 | Excellent 22.8% |
| Immigrants | Uganda | 84.0 /100 | #145 | Excellent 22.8% |
| Alsatians | 83.7 /100 | #146 | Excellent 22.8% |