French Canadian vs Syrian Hearing Disability
COMPARE
French Canadian
Syrian
Hearing Disability
Hearing Disability Comparison
French Canadians
Syrians
3.8%
HEARING DISABILITY
0.0/ 100
METRIC RATING
307th/ 347
METRIC RANK
3.1%
HEARING DISABILITY
19.2/ 100
METRIC RATING
199th/ 347
METRIC RANK
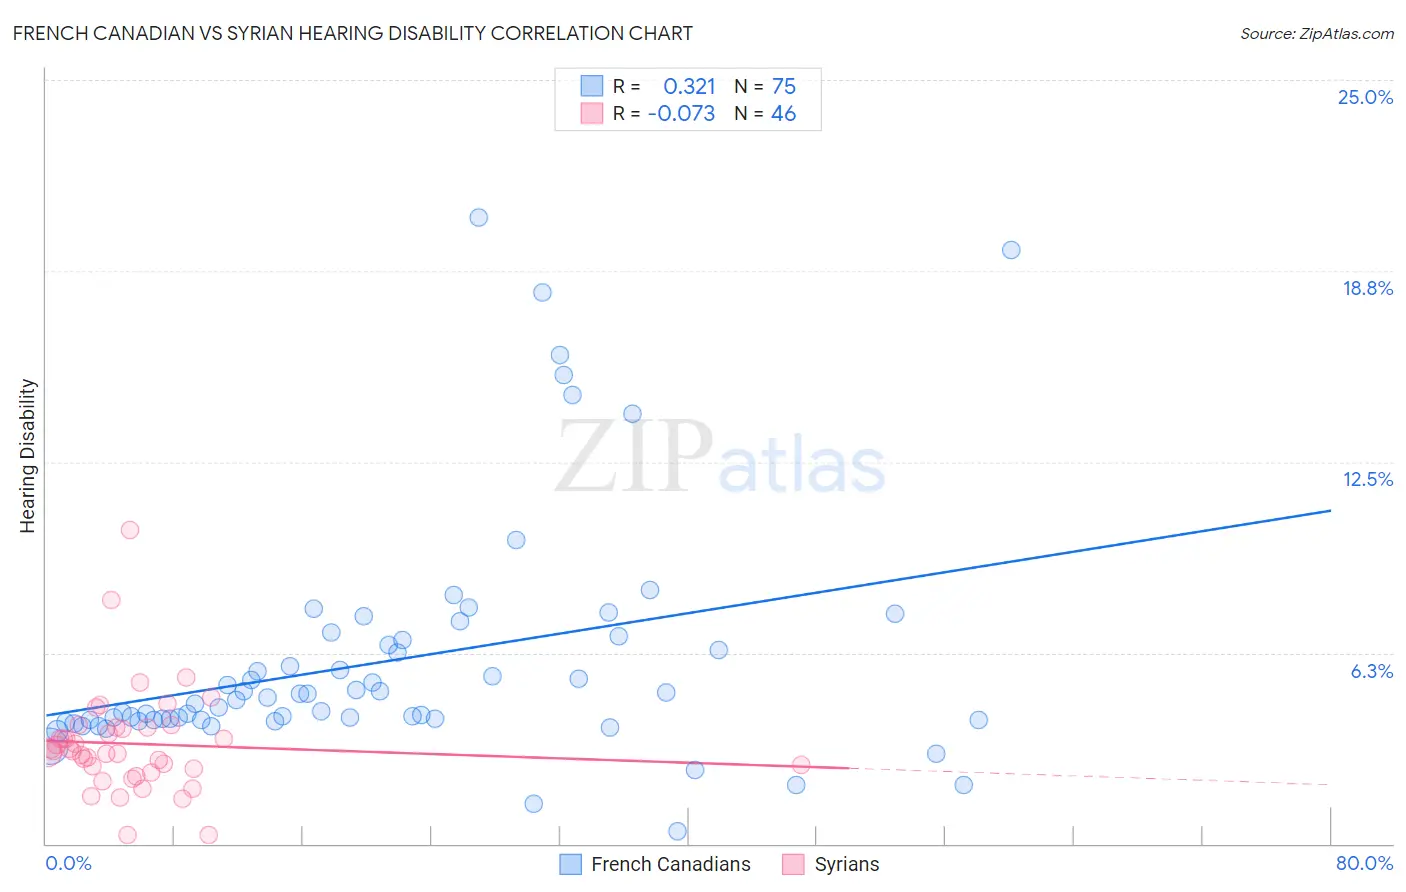
French Canadian vs Syrian Hearing Disability Correlation Chart
The statistical analysis conducted on geographies consisting of 502,335,766 people shows a mild positive correlation between the proportion of French Canadians and percentage of population with hearing disability in the United States with a correlation coefficient (R) of 0.321 and weighted average of 3.8%. Similarly, the statistical analysis conducted on geographies consisting of 266,258,902 people shows a slight negative correlation between the proportion of Syrians and percentage of population with hearing disability in the United States with a correlation coefficient (R) of -0.073 and weighted average of 3.1%, a difference of 23.1%.
Hearing Disability Correlation Summary
| Measurement | French Canadian | Syrian |
| Minimum | 0.39% | 0.27% |
| Maximum | 20.5% | 10.3% |
| Range | 20.1% | 10.0% |
| Mean | 6.0% | 3.3% |
| Median | 4.7% | 3.0% |
| Interquartile 25% (IQ1) | 4.0% | 2.5% |
| Interquartile 75% (IQ3) | 6.7% | 3.8% |
| Interquartile Range (IQR) | 2.6% | 1.3% |
| Standard Deviation (Sample) | 3.9% | 1.7% |
| Standard Deviation (Population) | 3.9% | 1.7% |
Similar Demographics by Hearing Disability
Demographics Similar to French Canadians by Hearing Disability
In terms of hearing disability, the demographic groups most similar to French Canadians are Marshallese (3.8%, a difference of 0.12%), Ottawa (3.8%, a difference of 0.44%), Scotch-Irish (3.8%, a difference of 0.52%), Cree (3.8%, a difference of 0.83%), and English (3.8%, a difference of 0.98%).
| Demographics | Rating | Rank | Hearing Disability |
| Scottish | 0.0 /100 | #300 | Tragic 3.7% |
| Pennsylvania Germans | 0.0 /100 | #301 | Tragic 3.7% |
| Dutch | 0.0 /100 | #302 | Tragic 3.7% |
| Menominee | 0.0 /100 | #303 | Tragic 3.7% |
| French | 0.0 /100 | #304 | Tragic 3.8% |
| English | 0.0 /100 | #305 | Tragic 3.8% |
| Marshallese | 0.0 /100 | #306 | Tragic 3.8% |
| French Canadians | 0.0 /100 | #307 | Tragic 3.8% |
| Ottawa | 0.0 /100 | #308 | Tragic 3.8% |
| Scotch-Irish | 0.0 /100 | #309 | Tragic 3.8% |
| Cree | 0.0 /100 | #310 | Tragic 3.8% |
| Americans | 0.0 /100 | #311 | Tragic 3.9% |
| Cajuns | 0.0 /100 | #312 | Tragic 3.9% |
| Hopi | 0.0 /100 | #313 | Tragic 3.9% |
| Yakama | 0.0 /100 | #314 | Tragic 3.9% |
Demographics Similar to Syrians by Hearing Disability
In terms of hearing disability, the demographic groups most similar to Syrians are Immigrants from North Macedonia (3.1%, a difference of 0.010%), Iraqi (3.1%, a difference of 0.030%), Immigrants from Croatia (3.1%, a difference of 0.18%), Immigrants from Bosnia and Herzegovina (3.1%, a difference of 0.20%), and Immigrants from Thailand (3.1%, a difference of 0.43%).
| Demographics | Rating | Rank | Hearing Disability |
| Koreans | 27.6 /100 | #192 | Fair 3.1% |
| Macedonians | 27.0 /100 | #193 | Fair 3.1% |
| South Africans | 24.5 /100 | #194 | Fair 3.1% |
| Spanish American Indians | 24.1 /100 | #195 | Fair 3.1% |
| Immigrants | Europe | 22.9 /100 | #196 | Fair 3.1% |
| Immigrants | Bosnia and Herzegovina | 20.6 /100 | #197 | Fair 3.1% |
| Immigrants | Croatia | 20.5 /100 | #198 | Fair 3.1% |
| Syrians | 19.2 /100 | #199 | Poor 3.1% |
| Immigrants | North Macedonia | 19.1 /100 | #200 | Poor 3.1% |
| Iraqis | 19.0 /100 | #201 | Poor 3.1% |
| Immigrants | Thailand | 16.4 /100 | #202 | Poor 3.1% |
| Immigrants | Denmark | 16.2 /100 | #203 | Poor 3.1% |
| Immigrants | Czechoslovakia | 15.9 /100 | #204 | Poor 3.1% |
| Alsatians | 15.9 /100 | #205 | Poor 3.1% |
| Eastern Europeans | 15.5 /100 | #206 | Poor 3.1% |