Asian vs Sierra Leonean Hearing Disability
COMPARE
Asian
Sierra Leonean
Hearing Disability
Hearing Disability Comparison
Asians
Sierra Leoneans
2.7%
HEARING DISABILITY
97.5/ 100
METRIC RATING
76th/ 347
METRIC RANK
2.5%
HEARING DISABILITY
99.9/ 100
METRIC RATING
13th/ 347
METRIC RANK
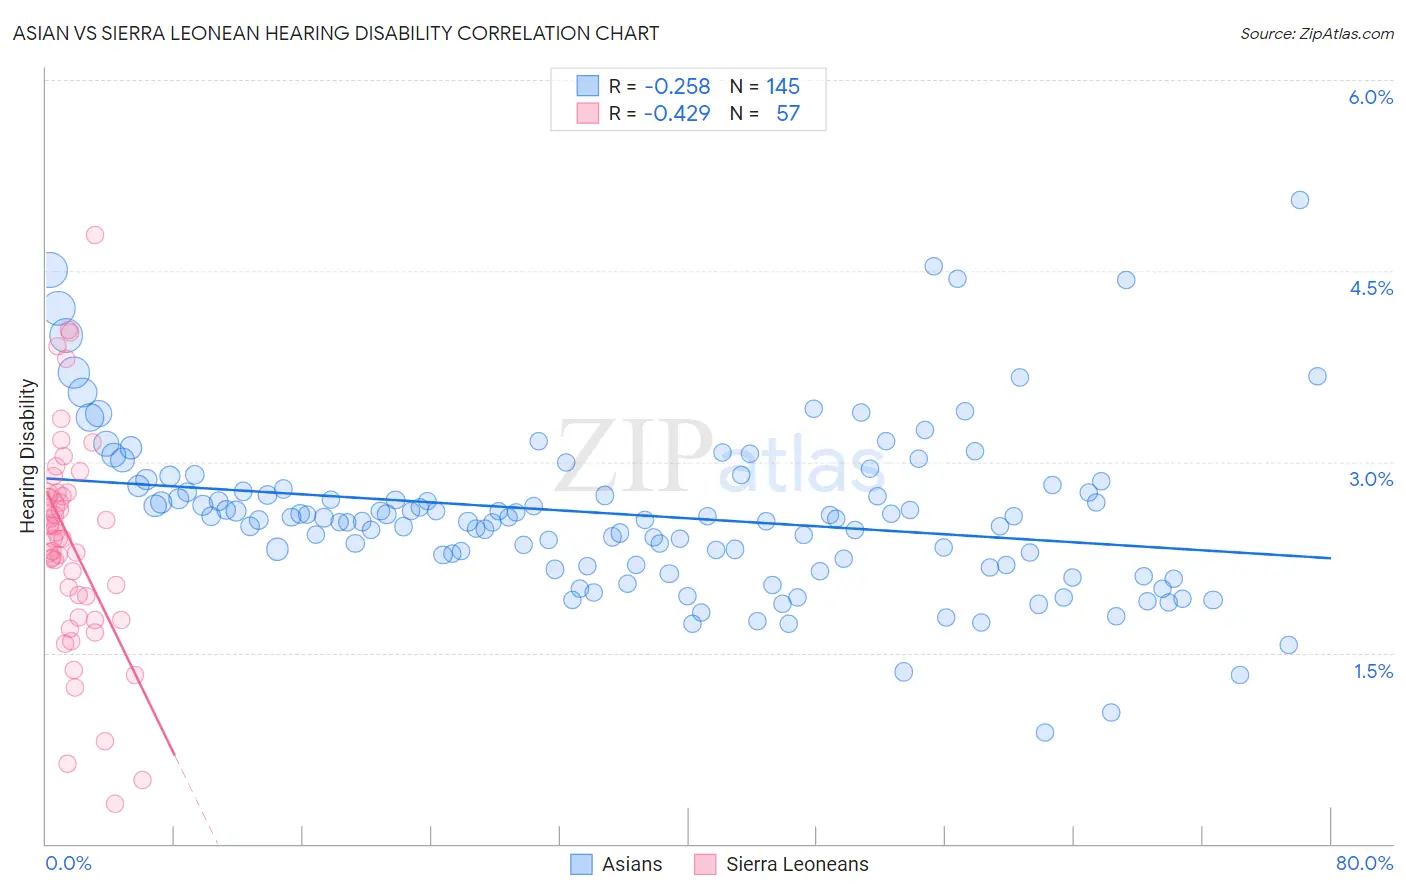
Asian vs Sierra Leonean Hearing Disability Correlation Chart
The statistical analysis conducted on geographies consisting of 550,340,322 people shows a weak negative correlation between the proportion of Asians and percentage of population with hearing disability in the United States with a correlation coefficient (R) of -0.258 and weighted average of 2.7%. Similarly, the statistical analysis conducted on geographies consisting of 83,339,030 people shows a moderate negative correlation between the proportion of Sierra Leoneans and percentage of population with hearing disability in the United States with a correlation coefficient (R) of -0.429 and weighted average of 2.5%, a difference of 9.5%.
Hearing Disability Correlation Summary
| Measurement | Asian | Sierra Leonean |
| Minimum | 0.87% | 0.31% |
| Maximum | 5.1% | 4.8% |
| Range | 4.2% | 4.5% |
| Mean | 2.6% | 2.4% |
| Median | 2.6% | 2.4% |
| Interquartile 25% (IQ1) | 2.2% | 1.9% |
| Interquartile 75% (IQ3) | 2.8% | 2.8% |
| Interquartile Range (IQR) | 0.60% | 0.89% |
| Standard Deviation (Sample) | 0.65% | 0.86% |
| Standard Deviation (Population) | 0.65% | 0.85% |
Similar Demographics by Hearing Disability
Demographics Similar to Asians by Hearing Disability
In terms of hearing disability, the demographic groups most similar to Asians are Immigrants from Saudi Arabia (2.7%, a difference of 0.0%), Immigrants from Malaysia (2.7%, a difference of 0.020%), Argentinean (2.7%, a difference of 0.030%), Immigrants from Korea (2.7%, a difference of 0.030%), and Mongolian (2.7%, a difference of 0.070%).
| Demographics | Rating | Rank | Hearing Disability |
| Nicaraguans | 97.9 /100 | #69 | Exceptional 2.7% |
| Peruvians | 97.7 /100 | #70 | Exceptional 2.7% |
| Central Americans | 97.7 /100 | #71 | Exceptional 2.7% |
| Afghans | 97.6 /100 | #72 | Exceptional 2.7% |
| Argentineans | 97.5 /100 | #73 | Exceptional 2.7% |
| Immigrants | Korea | 97.5 /100 | #74 | Exceptional 2.7% |
| Immigrants | Saudi Arabia | 97.5 /100 | #75 | Exceptional 2.7% |
| Asians | 97.5 /100 | #76 | Exceptional 2.7% |
| Immigrants | Malaysia | 97.5 /100 | #77 | Exceptional 2.7% |
| Mongolians | 97.4 /100 | #78 | Exceptional 2.7% |
| Colombians | 97.4 /100 | #79 | Exceptional 2.7% |
| Immigrants | Asia | 97.2 /100 | #80 | Exceptional 2.7% |
| Immigrants | Uruguay | 97.2 /100 | #81 | Exceptional 2.7% |
| Immigrants | Armenia | 97.2 /100 | #82 | Exceptional 2.7% |
| Immigrants | Cuba | 97.2 /100 | #83 | Exceptional 2.7% |
Demographics Similar to Sierra Leoneans by Hearing Disability
In terms of hearing disability, the demographic groups most similar to Sierra Leoneans are Trinidadian and Tobagonian (2.5%, a difference of 0.22%), Ecuadorian (2.5%, a difference of 0.32%), Immigrants from Trinidad and Tobago (2.5%, a difference of 0.53%), Barbadian (2.5%, a difference of 0.62%), and Immigrants from West Indies (2.5%, a difference of 0.77%).
| Demographics | Rating | Rank | Hearing Disability |
| Vietnamese | 100.0 /100 | #6 | Exceptional 2.4% |
| Immigrants | Bangladesh | 100.0 /100 | #7 | Exceptional 2.4% |
| British West Indians | 100.0 /100 | #8 | Exceptional 2.4% |
| Immigrants | Dominican Republic | 100.0 /100 | #9 | Exceptional 2.4% |
| Immigrants | Ecuador | 99.9 /100 | #10 | Exceptional 2.5% |
| Immigrants | Trinidad and Tobago | 99.9 /100 | #11 | Exceptional 2.5% |
| Trinidadians and Tobagonians | 99.9 /100 | #12 | Exceptional 2.5% |
| Sierra Leoneans | 99.9 /100 | #13 | Exceptional 2.5% |
| Ecuadorians | 99.9 /100 | #14 | Exceptional 2.5% |
| Barbadians | 99.9 /100 | #15 | Exceptional 2.5% |
| Immigrants | West Indies | 99.9 /100 | #16 | Exceptional 2.5% |
| Immigrants | India | 99.9 /100 | #17 | Exceptional 2.5% |
| Dominicans | 99.8 /100 | #18 | Exceptional 2.5% |
| Thais | 99.8 /100 | #19 | Exceptional 2.5% |
| Immigrants | Bolivia | 99.8 /100 | #20 | Exceptional 2.5% |