Apache vs Syrian Hearing Disability
COMPARE
Apache
Syrian
Hearing Disability
Hearing Disability Comparison
Apache
Syrians
4.1%
HEARING DISABILITY
0.0/ 100
METRIC RATING
323rd/ 347
METRIC RANK
3.1%
HEARING DISABILITY
19.2/ 100
METRIC RATING
199th/ 347
METRIC RANK
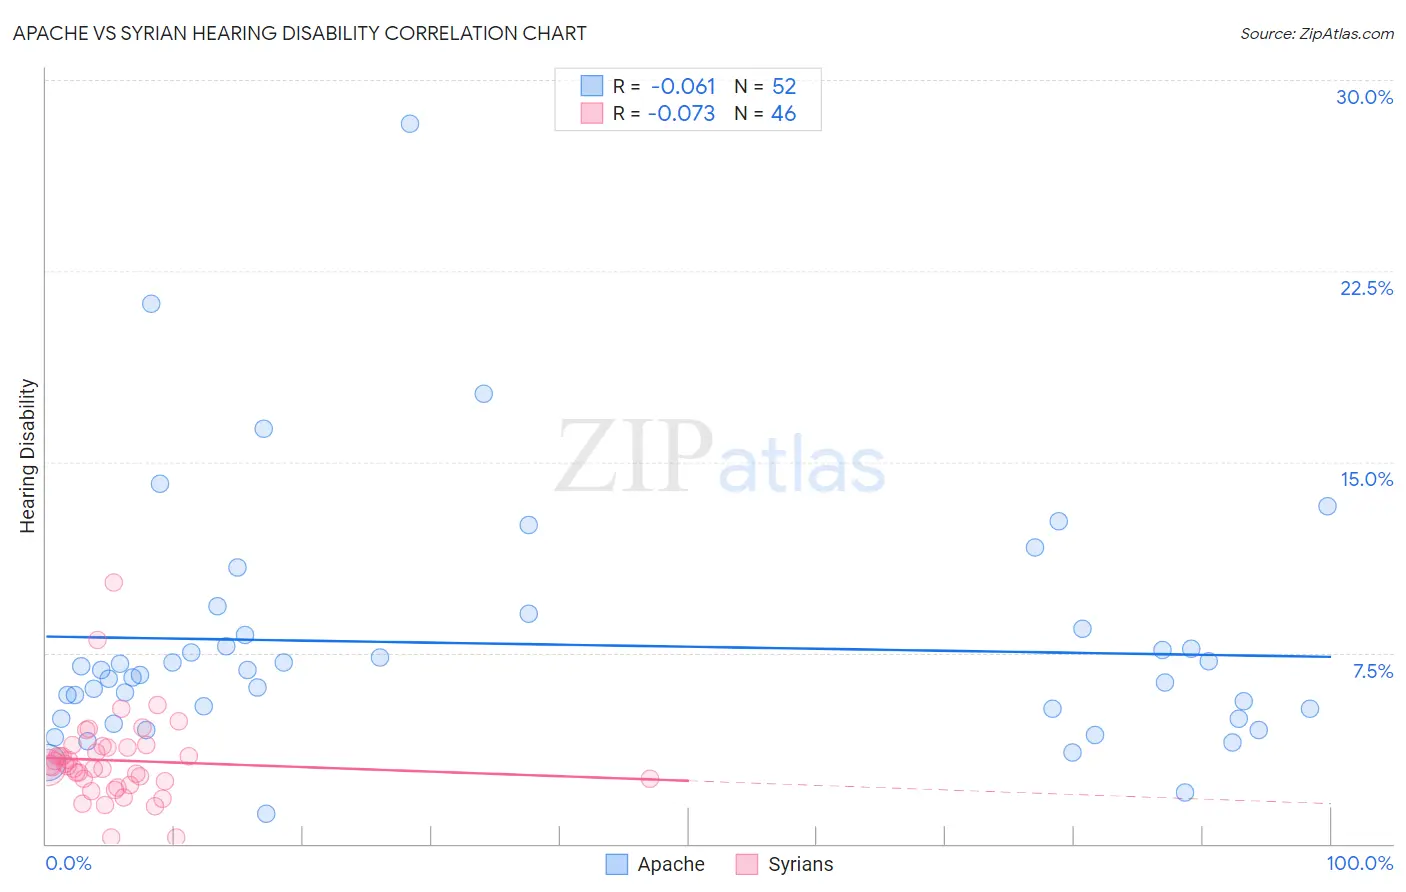
Apache vs Syrian Hearing Disability Correlation Chart
The statistical analysis conducted on geographies consisting of 231,022,751 people shows a slight negative correlation between the proportion of Apache and percentage of population with hearing disability in the United States with a correlation coefficient (R) of -0.061 and weighted average of 4.1%. Similarly, the statistical analysis conducted on geographies consisting of 266,258,902 people shows a slight negative correlation between the proportion of Syrians and percentage of population with hearing disability in the United States with a correlation coefficient (R) of -0.073 and weighted average of 3.1%, a difference of 32.2%.
Hearing Disability Correlation Summary
| Measurement | Apache | Syrian |
| Minimum | 1.2% | 0.27% |
| Maximum | 28.3% | 10.3% |
| Range | 27.1% | 10.0% |
| Mean | 7.8% | 3.3% |
| Median | 6.7% | 3.0% |
| Interquartile 25% (IQ1) | 5.1% | 2.5% |
| Interquartile 75% (IQ3) | 8.3% | 3.8% |
| Interquartile Range (IQR) | 3.2% | 1.3% |
| Standard Deviation (Sample) | 4.8% | 1.7% |
| Standard Deviation (Population) | 4.8% | 1.7% |
Similar Demographics by Hearing Disability
Demographics Similar to Apache by Hearing Disability
In terms of hearing disability, the demographic groups most similar to Apache are Osage (4.1%, a difference of 0.070%), Seminole (4.1%, a difference of 0.12%), Paiute (4.1%, a difference of 0.38%), Lumbee (4.1%, a difference of 0.39%), and Potawatomi (4.1%, a difference of 0.68%).
| Demographics | Rating | Rank | Hearing Disability |
| Spanish Americans | 0.0 /100 | #316 | Tragic 4.0% |
| Comanche | 0.0 /100 | #317 | Tragic 4.0% |
| Cheyenne | 0.0 /100 | #318 | Tragic 4.0% |
| Chippewa | 0.0 /100 | #319 | Tragic 4.0% |
| Shoshone | 0.0 /100 | #320 | Tragic 4.0% |
| Paiute | 0.0 /100 | #321 | Tragic 4.1% |
| Seminole | 0.0 /100 | #322 | Tragic 4.1% |
| Apache | 0.0 /100 | #323 | Tragic 4.1% |
| Osage | 0.0 /100 | #324 | Tragic 4.1% |
| Lumbee | 0.0 /100 | #325 | Tragic 4.1% |
| Potawatomi | 0.0 /100 | #326 | Tragic 4.1% |
| Arapaho | 0.0 /100 | #327 | Tragic 4.1% |
| Tohono O'odham | 0.0 /100 | #328 | Tragic 4.2% |
| Crow | 0.0 /100 | #329 | Tragic 4.2% |
| Natives/Alaskans | 0.0 /100 | #330 | Tragic 4.2% |
Demographics Similar to Syrians by Hearing Disability
In terms of hearing disability, the demographic groups most similar to Syrians are Immigrants from North Macedonia (3.1%, a difference of 0.010%), Iraqi (3.1%, a difference of 0.030%), Immigrants from Croatia (3.1%, a difference of 0.18%), Immigrants from Bosnia and Herzegovina (3.1%, a difference of 0.20%), and Immigrants from Thailand (3.1%, a difference of 0.43%).
| Demographics | Rating | Rank | Hearing Disability |
| Koreans | 27.6 /100 | #192 | Fair 3.1% |
| Macedonians | 27.0 /100 | #193 | Fair 3.1% |
| South Africans | 24.5 /100 | #194 | Fair 3.1% |
| Spanish American Indians | 24.1 /100 | #195 | Fair 3.1% |
| Immigrants | Europe | 22.9 /100 | #196 | Fair 3.1% |
| Immigrants | Bosnia and Herzegovina | 20.6 /100 | #197 | Fair 3.1% |
| Immigrants | Croatia | 20.5 /100 | #198 | Fair 3.1% |
| Syrians | 19.2 /100 | #199 | Poor 3.1% |
| Immigrants | North Macedonia | 19.1 /100 | #200 | Poor 3.1% |
| Iraqis | 19.0 /100 | #201 | Poor 3.1% |
| Immigrants | Thailand | 16.4 /100 | #202 | Poor 3.1% |
| Immigrants | Denmark | 16.2 /100 | #203 | Poor 3.1% |
| Immigrants | Czechoslovakia | 15.9 /100 | #204 | Poor 3.1% |
| Alsatians | 15.9 /100 | #205 | Poor 3.1% |
| Eastern Europeans | 15.5 /100 | #206 | Poor 3.1% |