Immigrants from Saudi Arabia vs Syrian Hearing Disability
COMPARE
Immigrants from Saudi Arabia
Syrian
Hearing Disability
Hearing Disability Comparison
Immigrants from Saudi Arabia
Syrians
2.7%
HEARING DISABILITY
97.5/ 100
METRIC RATING
75th/ 347
METRIC RANK
3.1%
HEARING DISABILITY
19.2/ 100
METRIC RATING
199th/ 347
METRIC RANK
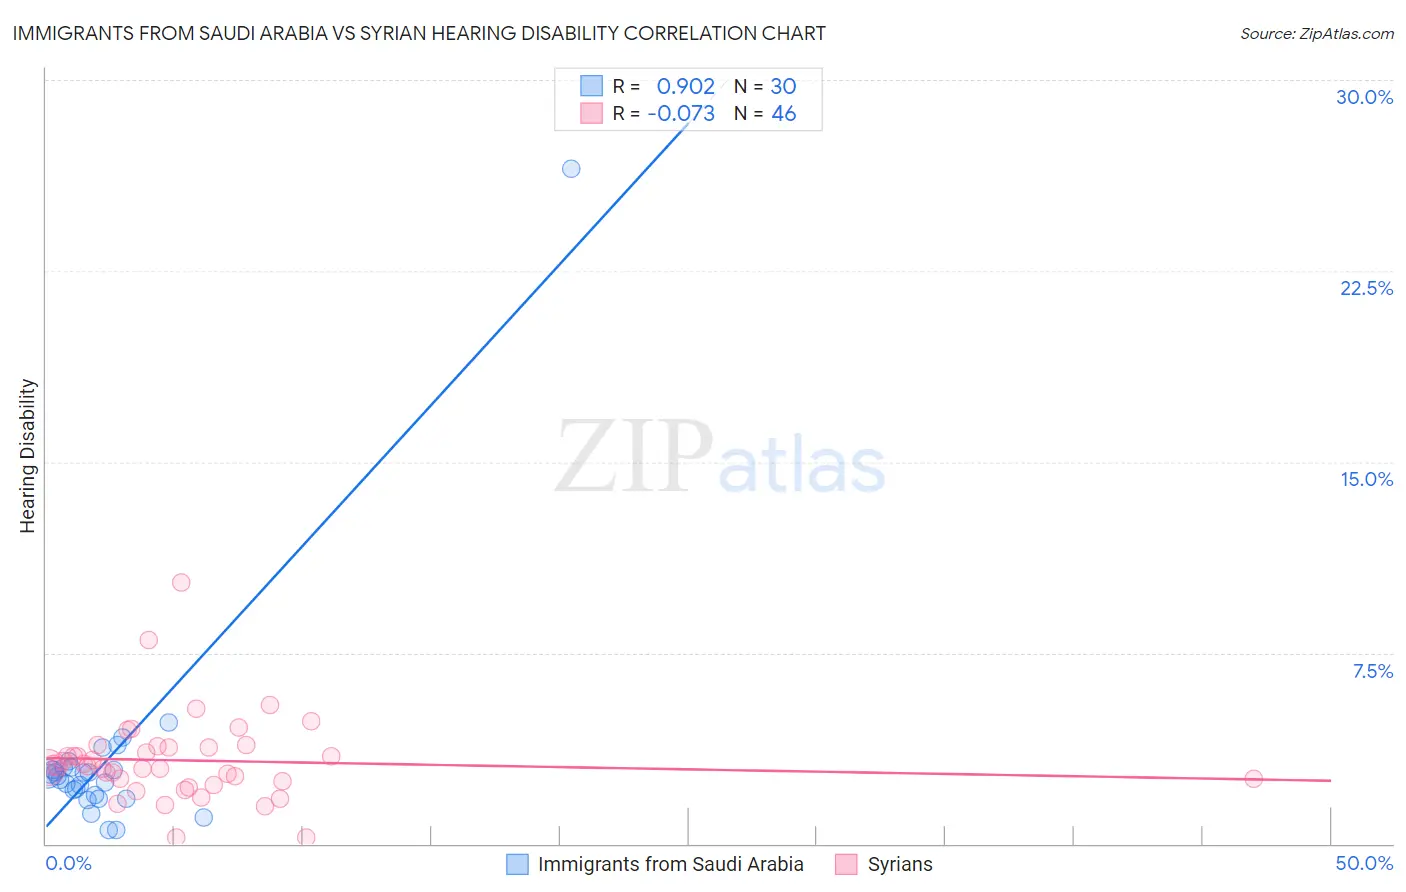
Immigrants from Saudi Arabia vs Syrian Hearing Disability Correlation Chart
The statistical analysis conducted on geographies consisting of 164,279,608 people shows a near-perfect positive correlation between the proportion of Immigrants from Saudi Arabia and percentage of population with hearing disability in the United States with a correlation coefficient (R) of 0.902 and weighted average of 2.7%. Similarly, the statistical analysis conducted on geographies consisting of 266,258,902 people shows a slight negative correlation between the proportion of Syrians and percentage of population with hearing disability in the United States with a correlation coefficient (R) of -0.073 and weighted average of 3.1%, a difference of 13.1%.
Hearing Disability Correlation Summary
| Measurement | Immigrants from Saudi Arabia | Syrian |
| Minimum | 0.52% | 0.27% |
| Maximum | 26.5% | 10.3% |
| Range | 26.0% | 10.0% |
| Mean | 3.3% | 3.3% |
| Median | 2.7% | 3.0% |
| Interquartile 25% (IQ1) | 1.9% | 2.5% |
| Interquartile 75% (IQ3) | 3.0% | 3.8% |
| Interquartile Range (IQR) | 1.1% | 1.3% |
| Standard Deviation (Sample) | 4.5% | 1.7% |
| Standard Deviation (Population) | 4.4% | 1.7% |
Similar Demographics by Hearing Disability
Demographics Similar to Immigrants from Saudi Arabia by Hearing Disability
In terms of hearing disability, the demographic groups most similar to Immigrants from Saudi Arabia are Asian (2.7%, a difference of 0.0%), Argentinean (2.7%, a difference of 0.030%), Immigrants from Korea (2.7%, a difference of 0.030%), Immigrants from Malaysia (2.7%, a difference of 0.030%), and Mongolian (2.7%, a difference of 0.070%).
| Demographics | Rating | Rank | Hearing Disability |
| Immigrants | Africa | 98.0 /100 | #68 | Exceptional 2.7% |
| Nicaraguans | 97.9 /100 | #69 | Exceptional 2.7% |
| Peruvians | 97.7 /100 | #70 | Exceptional 2.7% |
| Central Americans | 97.7 /100 | #71 | Exceptional 2.7% |
| Afghans | 97.6 /100 | #72 | Exceptional 2.7% |
| Argentineans | 97.5 /100 | #73 | Exceptional 2.7% |
| Immigrants | Korea | 97.5 /100 | #74 | Exceptional 2.7% |
| Immigrants | Saudi Arabia | 97.5 /100 | #75 | Exceptional 2.7% |
| Asians | 97.5 /100 | #76 | Exceptional 2.7% |
| Immigrants | Malaysia | 97.5 /100 | #77 | Exceptional 2.7% |
| Mongolians | 97.4 /100 | #78 | Exceptional 2.7% |
| Colombians | 97.4 /100 | #79 | Exceptional 2.7% |
| Immigrants | Asia | 97.2 /100 | #80 | Exceptional 2.7% |
| Immigrants | Uruguay | 97.2 /100 | #81 | Exceptional 2.7% |
| Immigrants | Armenia | 97.2 /100 | #82 | Exceptional 2.7% |
Demographics Similar to Syrians by Hearing Disability
In terms of hearing disability, the demographic groups most similar to Syrians are Immigrants from North Macedonia (3.1%, a difference of 0.010%), Iraqi (3.1%, a difference of 0.030%), Immigrants from Croatia (3.1%, a difference of 0.18%), Immigrants from Bosnia and Herzegovina (3.1%, a difference of 0.20%), and Immigrants from Thailand (3.1%, a difference of 0.43%).
| Demographics | Rating | Rank | Hearing Disability |
| Koreans | 27.6 /100 | #192 | Fair 3.1% |
| Macedonians | 27.0 /100 | #193 | Fair 3.1% |
| South Africans | 24.5 /100 | #194 | Fair 3.1% |
| Spanish American Indians | 24.1 /100 | #195 | Fair 3.1% |
| Immigrants | Europe | 22.9 /100 | #196 | Fair 3.1% |
| Immigrants | Bosnia and Herzegovina | 20.6 /100 | #197 | Fair 3.1% |
| Immigrants | Croatia | 20.5 /100 | #198 | Fair 3.1% |
| Syrians | 19.2 /100 | #199 | Poor 3.1% |
| Immigrants | North Macedonia | 19.1 /100 | #200 | Poor 3.1% |
| Iraqis | 19.0 /100 | #201 | Poor 3.1% |
| Immigrants | Thailand | 16.4 /100 | #202 | Poor 3.1% |
| Immigrants | Denmark | 16.2 /100 | #203 | Poor 3.1% |
| Immigrants | Czechoslovakia | 15.9 /100 | #204 | Poor 3.1% |
| Alsatians | 15.9 /100 | #205 | Poor 3.1% |
| Eastern Europeans | 15.5 /100 | #206 | Poor 3.1% |