Asian vs Cape Verdean 4th Grade
COMPARE
Asian
Cape Verdean
4th Grade
4th Grade Comparison
Asians
Cape Verdeans
97.1%
4TH GRADE
1.4/ 100
METRIC RATING
242nd/ 347
METRIC RANK
96.2%
4TH GRADE
0.0/ 100
METRIC RATING
312th/ 347
METRIC RANK
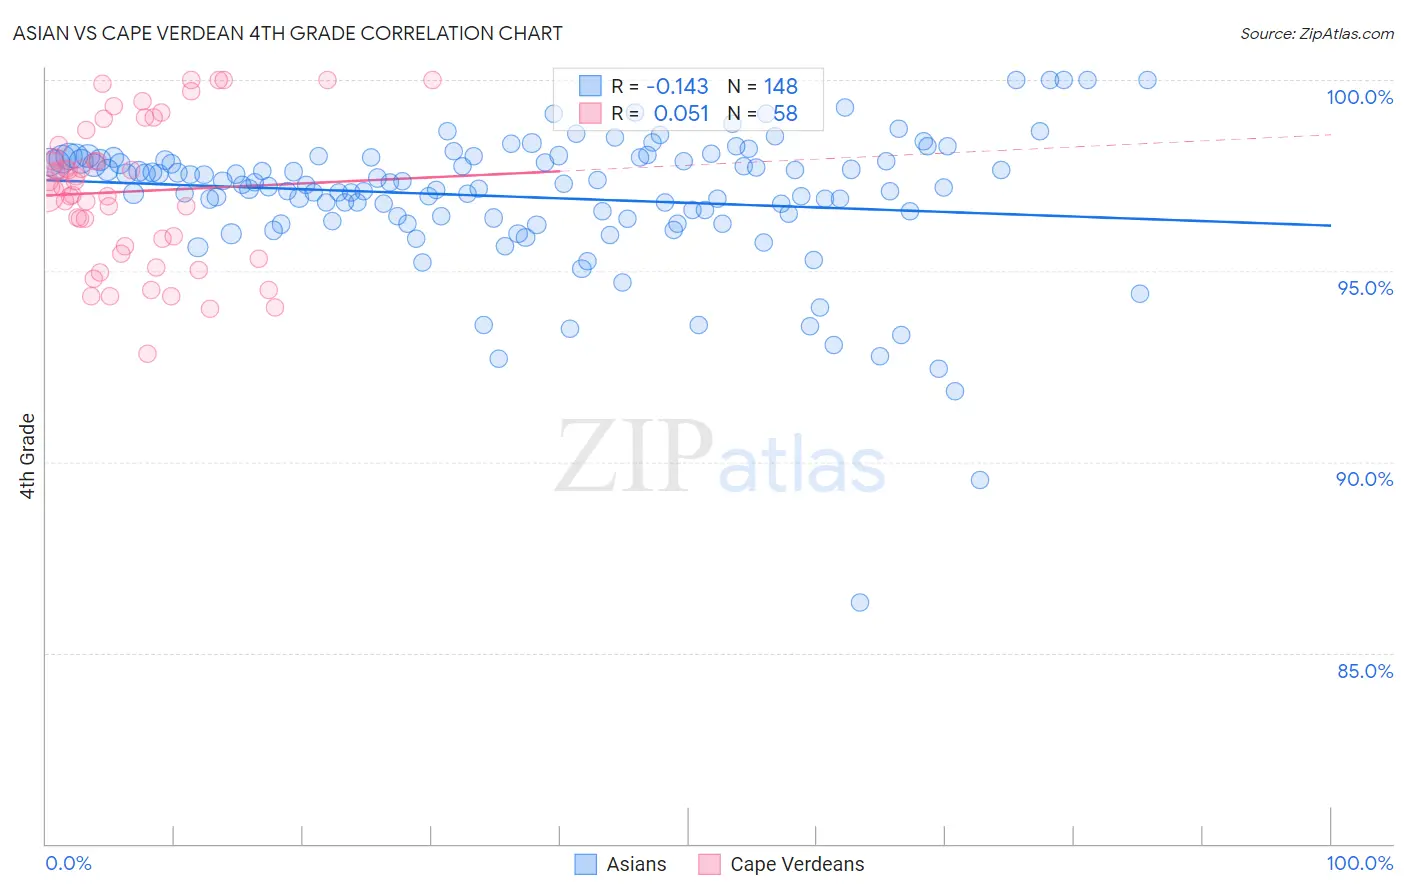
Asian vs Cape Verdean 4th Grade Correlation Chart
The statistical analysis conducted on geographies consisting of 550,860,618 people shows a poor negative correlation between the proportion of Asians and percentage of population with at least 4th grade education in the United States with a correlation coefficient (R) of -0.143 and weighted average of 97.1%. Similarly, the statistical analysis conducted on geographies consisting of 107,537,955 people shows a slight positive correlation between the proportion of Cape Verdeans and percentage of population with at least 4th grade education in the United States with a correlation coefficient (R) of 0.051 and weighted average of 96.2%, a difference of 0.92%.
4th Grade Correlation Summary
| Measurement | Asian | Cape Verdean |
| Minimum | 86.3% | 92.8% |
| Maximum | 100.0% | 100.0% |
| Range | 13.7% | 7.2% |
| Mean | 96.9% | 97.1% |
| Median | 97.3% | 97.2% |
| Interquartile 25% (IQ1) | 96.4% | 95.7% |
| Interquartile 75% (IQ3) | 97.9% | 98.3% |
| Interquartile Range (IQR) | 1.5% | 2.7% |
| Standard Deviation (Sample) | 1.9% | 1.9% |
| Standard Deviation (Population) | 1.9% | 1.8% |
Similar Demographics by 4th Grade
Demographics Similar to Asians by 4th Grade
In terms of 4th grade, the demographic groups most similar to Asians are U.S. Virgin Islander (97.1%, a difference of 0.0%), Colombian (97.1%, a difference of 0.010%), Immigrants from Indonesia (97.1%, a difference of 0.010%), Korean (97.1%, a difference of 0.010%), and Immigrants from Eastern Africa (97.1%, a difference of 0.010%).
| Demographics | Rating | Rank | 4th Grade |
| Yuman | 2.9 /100 | #235 | Tragic 97.2% |
| Immigrants | Eastern Asia | 2.7 /100 | #236 | Tragic 97.2% |
| Immigrants | Costa Rica | 2.0 /100 | #237 | Tragic 97.2% |
| Indians (Asian) | 1.9 /100 | #238 | Tragic 97.2% |
| Nigerians | 1.8 /100 | #239 | Tragic 97.1% |
| Colombians | 1.6 /100 | #240 | Tragic 97.1% |
| Immigrants | Indonesia | 1.5 /100 | #241 | Tragic 97.1% |
| Asians | 1.4 /100 | #242 | Tragic 97.1% |
| U.S. Virgin Islanders | 1.4 /100 | #243 | Tragic 97.1% |
| Koreans | 1.3 /100 | #244 | Tragic 97.1% |
| Immigrants | Eastern Africa | 1.2 /100 | #245 | Tragic 97.1% |
| Immigrants | Uruguay | 1.2 /100 | #246 | Tragic 97.1% |
| Ethiopians | 1.2 /100 | #247 | Tragic 97.1% |
| Immigrants | Asia | 1.2 /100 | #248 | Tragic 97.1% |
| Immigrants | Africa | 1.0 /100 | #249 | Tragic 97.1% |
Demographics Similar to Cape Verdeans by 4th Grade
In terms of 4th grade, the demographic groups most similar to Cape Verdeans are Immigrants from Bangladesh (96.2%, a difference of 0.010%), Indonesian (96.2%, a difference of 0.020%), Vietnamese (96.2%, a difference of 0.020%), Nicaraguan (96.2%, a difference of 0.030%), and Immigrants from Ecuador (96.2%, a difference of 0.030%).
| Demographics | Rating | Rank | 4th Grade |
| Immigrants | Caribbean | 0.0 /100 | #305 | Tragic 96.4% |
| Sri Lankans | 0.0 /100 | #306 | Tragic 96.4% |
| Immigrants | Haiti | 0.0 /100 | #307 | Tragic 96.3% |
| Immigrants | Laos | 0.0 /100 | #308 | Tragic 96.3% |
| Immigrants | Guyana | 0.0 /100 | #309 | Tragic 96.3% |
| Immigrants | Burma/Myanmar | 0.0 /100 | #310 | Tragic 96.3% |
| Immigrants | Bangladesh | 0.0 /100 | #311 | Tragic 96.2% |
| Cape Verdeans | 0.0 /100 | #312 | Tragic 96.2% |
| Indonesians | 0.0 /100 | #313 | Tragic 96.2% |
| Vietnamese | 0.0 /100 | #314 | Tragic 96.2% |
| Nicaraguans | 0.0 /100 | #315 | Tragic 96.2% |
| Immigrants | Ecuador | 0.0 /100 | #316 | Tragic 96.2% |
| Central American Indians | 0.0 /100 | #317 | Tragic 96.2% |
| Immigrants | Azores | 0.0 /100 | #318 | Tragic 96.1% |
| Belizeans | 0.0 /100 | #319 | Tragic 96.1% |