Armenian vs U.S. Virgin Islander Disability Age 35 to 64

COMPARE

Armenian
Race
Ancestry
AfghanAfricanAlaska NativeAlaskan AthabascanAlbanianAleutAlsatianAmericanApacheArabArapahoArgentineanArmenianAssyrian/Chaldean/SyriacAustralianAustrianBahamianBangladeshiBarbadianBasqueBelgianBelizeanBermudanBhutaneseBlackfeetBolivianBrazilianBritishBritish West IndianBulgarianBurmeseCajunCambodianCanadianCape VerdeanCarpatho RusynCelticCentral AmericanCentral American IndianCherokeeCheyenneChickasawChileanChineseChippewaChoctawColombianColvilleComancheCosta RicanCreeCreekCroatianCrowCubanCypriotCzechCzechoslovakianDanishDelawareDominicanDutchDutch West IndianEastern EuropeanEcuadorianEgyptianEnglishEstonianEthiopianEuropeanFijianFilipinoFinnishFrenchFrench American IndianFrench CanadianGermanGerman RussianGhanaianGreekGuamanian/ChamorroGuatemalanGuyaneseHaitianHmongHonduranHopiHoumaHungarianIcelanderIndian (Asian)IndonesianInupiatIranianIraqiIrishIroquoisIsraeliItalianJamaicanJapaneseJordanianKenyanKiowaKoreanLaotianLatvianLebaneseLiberianLithuanianLumbeeLuxembourgerMacedonianMalaysianMalteseMarshalleseMenomineeMexicanMexican American IndianMongolianMoroccanNative HawaiianNavajoNepaleseNew ZealanderNicaraguanNigerianNorthern EuropeanNorwegianOkinawanOsageOttawaPaiutePakistaniPalestinianPanamanianParaguayanPennsylvania GermanPeruvianPimaPolishPortuguesePotawatomiPuebloPuerto RicanPuget Sound SalishRomanianRussianSalvadoranSamoanScandinavianScotch-IrishScottishSeminoleSenegaleseSerbianShoshoneSierra LeoneanSiouxSlavicSlovakSloveneSomaliSouth AfricanSouth AmericanSouth American IndianSoviet UnionSpaniardSpanishSpanish AmericanSpanish American IndianSri LankanSubsaharan AfricanSudaneseSwedishSwissSyrianTaiwaneseThaiTlingit-HaidaTohono O'OdhamTonganTrinidadian and TobagonianTsimshianTurkishUgandanUkrainianUruguayanUteVenezuelanVietnameseWelshWest IndianYakamaYaquiYugoslavianYumanYup'ikZimbabwean
Immigration
NonimmigrantsImmigrantsAfghanistanAfricaAlbaniaArgentinaArmeniaAsiaAustraliaAustriaBahamasBangladeshBarbadosBelarusBelgiumBelizeBoliviaBosnia and HerzegovinaBrazilBulgariaBurma/MyanmarCabo VerdeCambodiaCameroonCanadaCaribbeanCentral AmericaChileChinaColombiaCongoCosta RicaCroatiaCubaCzechoslovakiaDenmarkDominicaDominican RepublicEastern AfricaEastern AsiaEastern EuropeEcuadorEgyptEl SalvadorEnglandEritreaEthiopiaEuropeFijiFranceGermanyGhanaGreeceGrenadaGuatemalaGuyanaHaitiHondurasHong KongHungaryIndiaIndonesiaIranIraqIrelandIsraelItalyJamaicaJapanJordanKazakhstanKenyaKoreaKuwaitLaosLatin AmericaLatviaLebanonLiberiaLithuaniaMalaysiaMexicoMicronesiaMiddle AfricaMoldovaMoroccoNepalNetherlandsNicaraguaNigeriaNorth AmericaNorth MacedoniaNorthern AfricaNorthern EuropeNorwayOceaniaPakistanPanamaPeruPhilippinesPolandPortugalRomaniaRussiaSaudi ArabiaScotlandSenegalSerbiaSierra LeoneSingaporeSomaliaSouth AfricaSouth AmericaSouth Central AsiaSouth Eastern AsiaSouthern EuropeSpainSri LankaSt. Vincent and the GrenadinesSudanSwedenSwitzerlandSyriaTaiwanThailandTrinidad and TobagoTurkeyUgandaUkraineUruguayUzbekistanVenezuelaVietnamWest IndiesWestern AfricaWestern AsiaWestern EuropeYemenZaireZimbabweAzores
U.S. Virgin Islander
Race
Ancestry
AfghanAfricanAlaska NativeAlaskan AthabascanAlbanianAleutAlsatianAmericanApacheArabArapahoArgentineanAssyrian/Chaldean/SyriacAustralianAustrianBahamianBangladeshiBarbadianBasqueBelgianBelizeanBermudanBhutaneseBlackfeetBolivianBrazilianBritishBritish West IndianBulgarianBurmeseCajunCambodianCanadianCape VerdeanCarpatho RusynCelticCentral AmericanCentral American IndianCherokeeCheyenneChickasawChileanChineseChippewaChoctawColombianColvilleComancheCosta RicanCreeCreekCroatianCrowCubanCypriotCzechCzechoslovakianDanishDelawareDominicanDutchDutch West IndianEastern EuropeanEcuadorianEgyptianEnglishEstonianEthiopianEuropeanFijianFilipinoFinnishFrenchFrench American IndianFrench CanadianGermanGerman RussianGhanaianGreekGuamanian/ChamorroGuatemalanGuyaneseHaitianHmongHonduranHopiHoumaHungarianIcelanderIndian (Asian)IndonesianInupiatIranianIraqiIrishIroquoisIsraeliItalianJamaicanJapaneseJordanianKenyanKiowaKoreanLaotianLatvianLebaneseLiberianLithuanianLumbeeLuxembourgerMacedonianMalaysianMalteseMarshalleseMenomineeMexicanMexican American IndianMongolianMoroccanNative HawaiianNavajoNepaleseNew ZealanderNicaraguanNigerianNorthern EuropeanNorwegianOkinawanOsageOttawaPaiutePakistaniPalestinianPanamanianParaguayanPennsylvania GermanPeruvianPimaPolishPortuguesePotawatomiPuebloPuerto RicanPuget Sound SalishRomanianRussianSalvadoranSamoanScandinavianScotch-IrishScottishSeminoleSenegaleseSerbianShoshoneSierra LeoneanSiouxSlavicSlovakSloveneSomaliSouth AfricanSouth AmericanSouth American IndianSoviet UnionSpaniardSpanishSpanish AmericanSpanish American IndianSri LankanSubsaharan AfricanSudaneseSwedishSwissSyrianTaiwaneseThaiTlingit-HaidaTohono O'OdhamTonganTrinidadian and TobagonianTsimshianTurkishU.S. Virgin IslanderUgandanUkrainianUruguayanUteVenezuelanVietnameseWelshWest IndianYakamaYaquiYugoslavianYumanYup'ikZimbabwean
Immigration
NonimmigrantsImmigrantsAfghanistanAfricaAlbaniaArgentinaArmeniaAsiaAustraliaAustriaBahamasBangladeshBarbadosBelarusBelgiumBelizeBoliviaBosnia and HerzegovinaBrazilBulgariaBurma/MyanmarCabo VerdeCambodiaCameroonCanadaCaribbeanCentral AmericaChileChinaColombiaCongoCosta RicaCroatiaCubaCzechoslovakiaDenmarkDominicaDominican RepublicEastern AfricaEastern AsiaEastern EuropeEcuadorEgyptEl SalvadorEnglandEritreaEthiopiaEuropeFijiFranceGermanyGhanaGreeceGrenadaGuatemalaGuyanaHaitiHondurasHong KongHungaryIndiaIndonesiaIranIraqIrelandIsraelItalyJamaicaJapanJordanKazakhstanKenyaKoreaKuwaitLaosLatin AmericaLatviaLebanonLiberiaLithuaniaMalaysiaMexicoMicronesiaMiddle AfricaMoldovaMoroccoNepalNetherlandsNicaraguaNigeriaNorth AmericaNorth MacedoniaNorthern AfricaNorthern EuropeNorwayOceaniaPakistanPanamaPeruPhilippinesPolandPortugalRomaniaRussiaSaudi ArabiaScotlandSenegalSerbiaSierra LeoneSingaporeSomaliaSouth AfricaSouth AmericaSouth Central AsiaSouth Eastern AsiaSouthern EuropeSpainSri LankaSt. Vincent and the GrenadinesSudanSwedenSwitzerlandSyriaTaiwanThailandTrinidad and TobagoTurkeyUgandaUkraineUruguayUzbekistanVenezuelaVietnamWest IndiesWestern AfricaWestern AsiaWestern EuropeYemenZaireZimbabweAzores
Disability Age 35 to 64
Income
Poverty
Unemployment
Labor Participation
Family Structure
Vehicle Availability
Education Level
Disability

Disability Age 35 to 64 Comparison

Armenians

U.S. Virgin Islanders

Exceptional
Tragic
9.9%
DISABILITY AGE 35 TO 64
99.8/ 100
METRIC RATING
58th/ 347
METRIC RANK
12.8%
DISABILITY AGE 35 TO 64
0.1/ 100
METRIC RATING
272nd/ 347
METRIC RANK

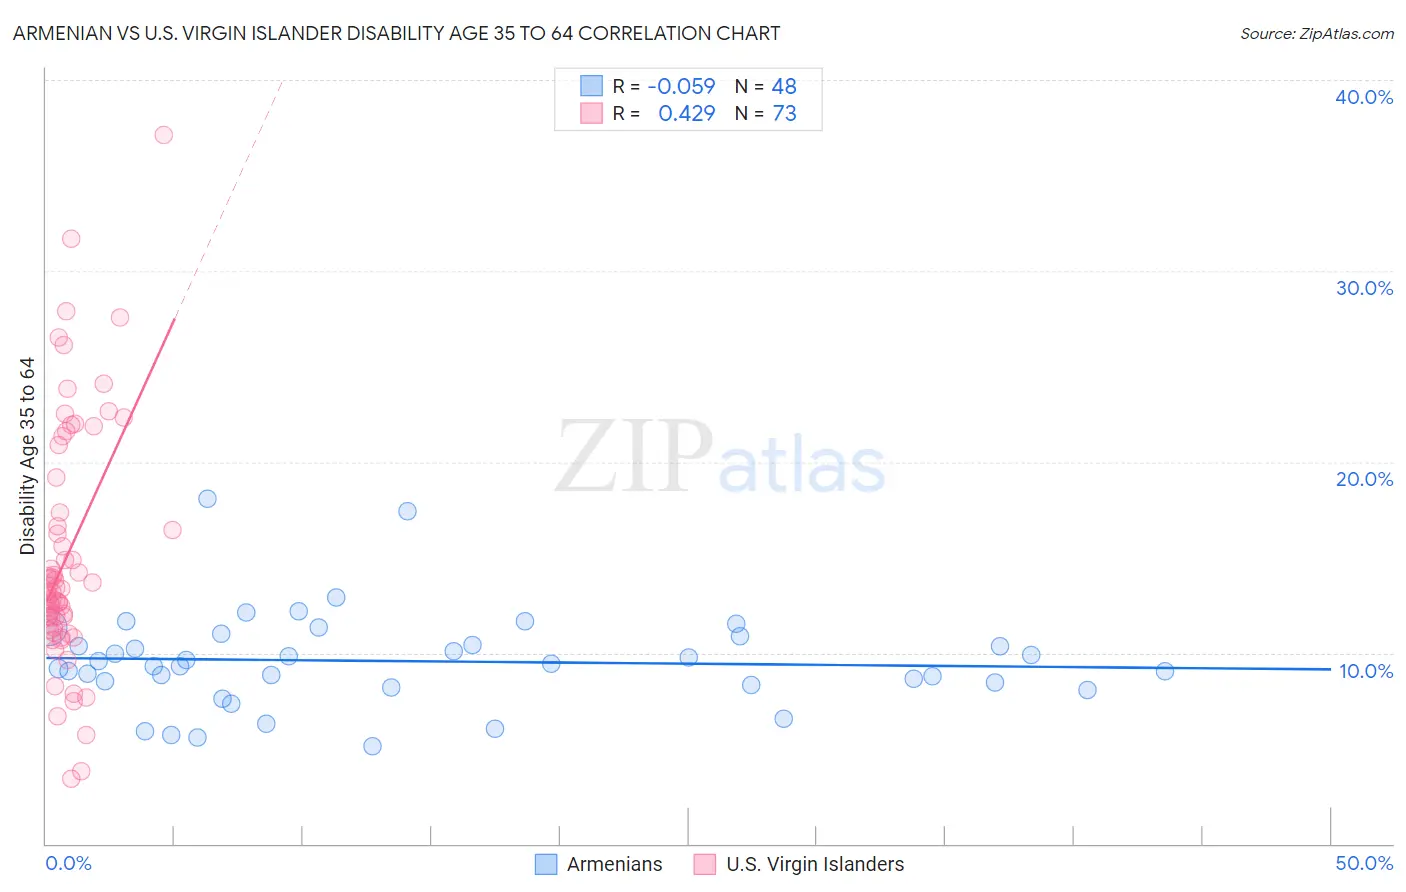
Armenian vs U.S. Virgin Islander Disability Age 35 to 64 Correlation Chart

The statistical analysis conducted on geographies consisting of 310,760,259 people shows a slight negative correlation between the proportion of Armenians and percentage of population with a disability between the ages 34 and 64 in the United States with a correlation coefficient (R) of -0.059 and weighted average of 9.9%. Similarly, the statistical analysis conducted on geographies consisting of 87,508,823 people shows a moderate positive correlation between the proportion of U.S. Virgin Islanders and percentage of population with a disability between the ages 34 and 64 in the United States with a correlation coefficient (R) of 0.429 and weighted average of 12.8%, a difference of 29.8%.
Armenian vs U.S. Virgin Islander Disability Age 35 to 64

Disability Age 35 to 64 Correlation Summary

MeasurementArmenianU.S. Virgin Islander
Minimum5.1%3.4%
Maximum18.0%37.1%
Range12.9%33.7%
Mean9.6%15.0%
Median9.4%13.2%
Interquartile 25% (IQ1)8.4%11.4%
Interquartile 75% (IQ3)10.6%18.3%
Interquartile Range (IQR)2.3%6.8%
Standard Deviation (Sample)2.5%6.4%
Standard Deviation (Population)2.5%6.3%

Similar Demographics by Disability Age 35 to 64

Demographics Similar to Armenians by Disability Age 35 to 64

In terms of disability age 35 to 64, the demographic groups most similar to Armenians are Colombian (9.9%, a difference of 0.10%), South American (9.9%, a difference of 0.12%), Immigrants from Sweden (9.9%, a difference of 0.30%), Peruvian (9.9%, a difference of 0.34%), and Immigrants from Russia (9.8%, a difference of 0.40%).
DemographicsRating | RankDisability Age 35 to 64
Bhutanese
99.8
/100
|
#51
Exceptional
9.8%
Immigrants | Bulgaria
99.8
/100
|
#52
Exceptional
9.8%
Taiwanese
99.8
/100
|
#53
Exceptional
9.8%
Immigrants | Russia
99.8
/100
|
#54
Exceptional
9.8%
Peruvians
99.8
/100
|
#55
Exceptional
9.9%
South Americans
99.8
/100
|
#56
Exceptional
9.9%
Colombians
99.8
/100
|
#57
Exceptional
9.9%
Armenians
99.8
/100
|
#58
Exceptional
9.9%
Immigrants | Sweden
99.7
/100
|
#59
Exceptional
9.9%
Immigrants | South America
99.7
/100
|
#60
Exceptional
9.9%
Immigrants | Spain
99.7
/100
|
#61
Exceptional
10.0%
Eastern Europeans
99.7
/100
|
#62
Exceptional
10.0%
Immigrants | Czechoslovakia
99.7
/100
|
#63
Exceptional
10.0%
Immigrants | Romania
99.7
/100
|
#64
Exceptional
10.0%
Immigrants | Poland
99.6
/100
|
#65
Exceptional
10.0%

Demographics Similar to U.S. Virgin Islanders by Disability Age 35 to 64

In terms of disability age 35 to 64, the demographic groups most similar to U.S. Virgin Islanders are Pennsylvania German (12.8%, a difference of 0.080%), Celtic (12.9%, a difference of 0.11%), Nepalese (12.8%, a difference of 0.12%), Dominican (12.9%, a difference of 0.25%), and Somali (12.9%, a difference of 0.37%).
DemographicsRating | RankDisability Age 35 to 64
Marshallese
0.4
/100
|
#265
Tragic
12.5%
Whites/Caucasians
0.3
/100
|
#266
Tragic
12.6%
Sub-Saharan Africans
0.2
/100
|
#267
Tragic
12.6%
Immigrants | Dominica
0.2
/100
|
#268
Tragic
12.7%
Spanish
0.2
/100
|
#269
Tragic
12.7%
French
0.2
/100
|
#270
Tragic
12.7%
Nepalese
0.1
/100
|
#271
Tragic
12.8%
U.S. Virgin Islanders
0.1
/100
|
#272
Tragic
12.8%
Pennsylvania Germans
0.1
/100
|
#273
Tragic
12.8%
Celtics
0.1
/100
|
#274
Tragic
12.9%
Dominicans
0.1
/100
|
#275
Tragic
12.9%
Somalis
0.1
/100
|
#276
Tragic
12.9%
Immigrants | Dominican Republic
0.1
/100
|
#277
Tragic
12.9%
French Canadians
0.1
/100
|
#278
Tragic
12.9%
Immigrants | Micronesia
0.1
/100
|
#279
Tragic
12.9%