Armenian vs Liberian Cognitive Disability
COMPARE
Armenian
Liberian
Cognitive Disability
Cognitive Disability Comparison
Armenians
Liberians
17.2%
COGNITIVE DISABILITY
70.1/ 100
METRIC RATING
164th/ 347
METRIC RANK
18.6%
COGNITIVE DISABILITY
0.0/ 100
METRIC RATING
317th/ 347
METRIC RANK
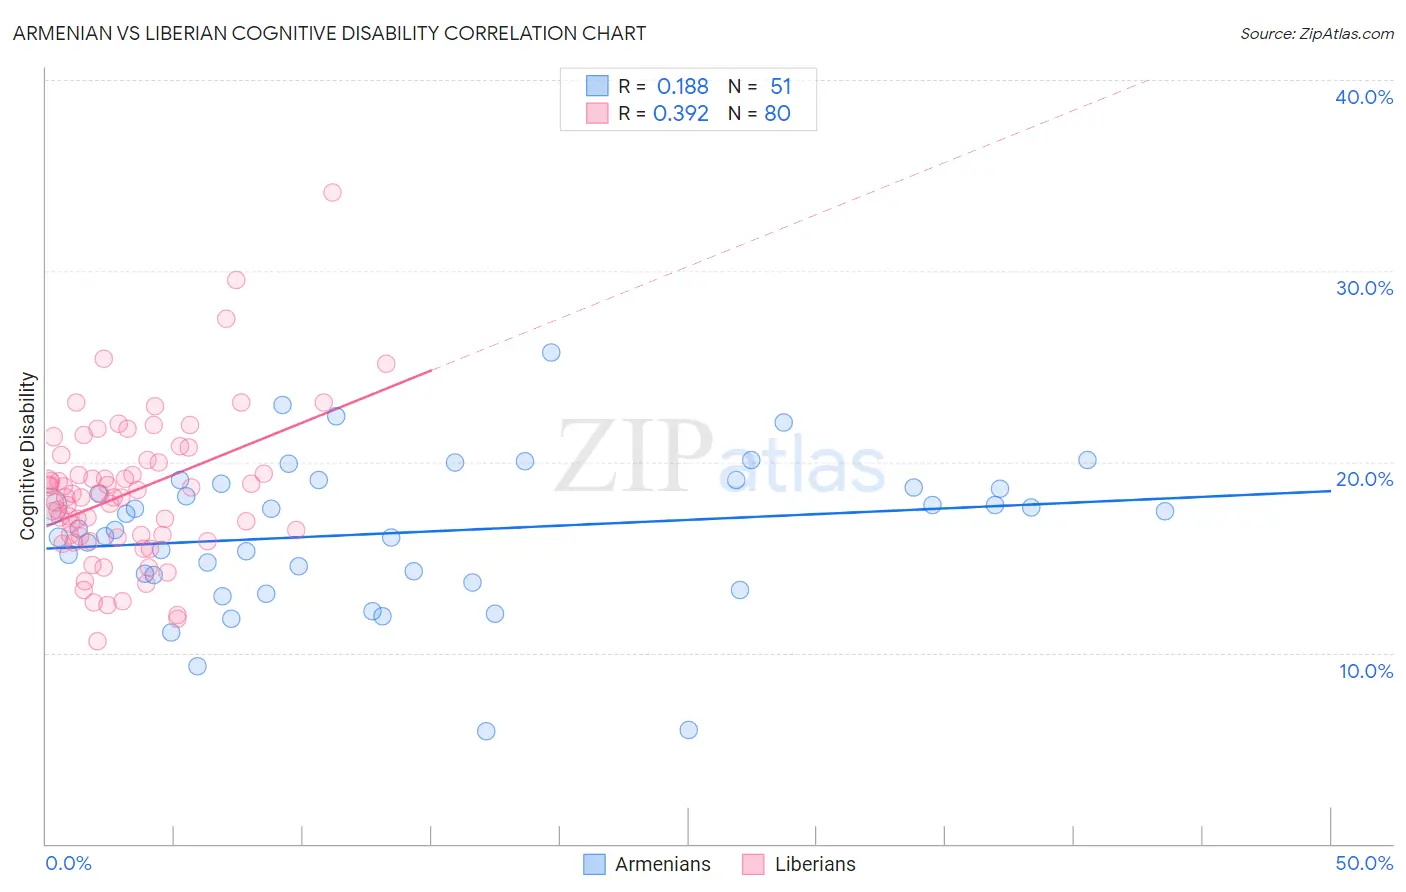
Armenian vs Liberian Cognitive Disability Correlation Chart
The statistical analysis conducted on geographies consisting of 310,934,651 people shows a poor positive correlation between the proportion of Armenians and percentage of population with cognitive disability in the United States with a correlation coefficient (R) of 0.188 and weighted average of 17.2%. Similarly, the statistical analysis conducted on geographies consisting of 118,084,793 people shows a mild positive correlation between the proportion of Liberians and percentage of population with cognitive disability in the United States with a correlation coefficient (R) of 0.392 and weighted average of 18.6%, a difference of 8.2%.
Cognitive Disability Correlation Summary
| Measurement | Armenian | Liberian |
| Minimum | 5.9% | 10.6% |
| Maximum | 25.7% | 34.1% |
| Range | 19.9% | 23.5% |
| Mean | 16.3% | 18.4% |
| Median | 16.5% | 18.1% |
| Interquartile 25% (IQ1) | 14.1% | 16.1% |
| Interquartile 75% (IQ3) | 18.8% | 20.1% |
| Interquartile Range (IQR) | 4.8% | 4.0% |
| Standard Deviation (Sample) | 3.9% | 3.9% |
| Standard Deviation (Population) | 3.9% | 3.9% |
Similar Demographics by Cognitive Disability
Demographics Similar to Armenians by Cognitive Disability
In terms of cognitive disability, the demographic groups most similar to Armenians are Yugoslavian (17.2%, a difference of 0.050%), Immigrants from Switzerland (17.2%, a difference of 0.050%), American (17.2%, a difference of 0.070%), Australian (17.2%, a difference of 0.080%), and Immigrants from Latvia (17.2%, a difference of 0.11%).
| Demographics | Rating | Rank | Cognitive Disability |
| Immigrants | Australia | 76.0 /100 | #157 | Good 17.1% |
| Celtics | 74.1 /100 | #158 | Good 17.1% |
| Immigrants | Latvia | 73.2 /100 | #159 | Good 17.2% |
| Australians | 72.4 /100 | #160 | Good 17.2% |
| Americans | 72.2 /100 | #161 | Good 17.2% |
| Yugoslavians | 71.6 /100 | #162 | Good 17.2% |
| Immigrants | Switzerland | 71.5 /100 | #163 | Good 17.2% |
| Armenians | 70.1 /100 | #164 | Good 17.2% |
| Immigrants | Albania | 64.9 /100 | #165 | Good 17.2% |
| Immigrants | Ecuador | 64.4 /100 | #166 | Good 17.2% |
| Immigrants | Syria | 63.5 /100 | #167 | Good 17.2% |
| Immigrants | Immigrants | 62.5 /100 | #168 | Good 17.2% |
| Immigrants | Portugal | 61.8 /100 | #169 | Good 17.2% |
| Ecuadorians | 59.6 /100 | #170 | Average 17.2% |
| Tlingit-Haida | 59.4 /100 | #171 | Average 17.2% |
Demographics Similar to Liberians by Cognitive Disability
In terms of cognitive disability, the demographic groups most similar to Liberians are Immigrants from Middle Africa (18.6%, a difference of 0.080%), Bangladeshi (18.6%, a difference of 0.12%), Immigrants from Dominica (18.6%, a difference of 0.16%), Comanche (18.6%, a difference of 0.16%), and Apache (18.6%, a difference of 0.20%).
| Demographics | Rating | Rank | Cognitive Disability |
| Choctaw | 0.0 /100 | #310 | Tragic 18.4% |
| Hmong | 0.0 /100 | #311 | Tragic 18.4% |
| Chickasaw | 0.0 /100 | #312 | Tragic 18.5% |
| Yaqui | 0.0 /100 | #313 | Tragic 18.5% |
| Sub-Saharan Africans | 0.0 /100 | #314 | Tragic 18.5% |
| Immigrants | Dominica | 0.0 /100 | #315 | Tragic 18.6% |
| Immigrants | Middle Africa | 0.0 /100 | #316 | Tragic 18.6% |
| Liberians | 0.0 /100 | #317 | Tragic 18.6% |
| Bangladeshis | 0.0 /100 | #318 | Tragic 18.6% |
| Comanche | 0.0 /100 | #319 | Tragic 18.6% |
| Apache | 0.0 /100 | #320 | Tragic 18.6% |
| Africans | 0.0 /100 | #321 | Tragic 18.6% |
| Immigrants | Liberia | 0.0 /100 | #322 | Tragic 18.7% |
| Pueblo | 0.0 /100 | #323 | Tragic 18.7% |
| Dominicans | 0.0 /100 | #324 | Tragic 18.7% |