Arapaho vs Taiwanese Male Disability
COMPARE
Arapaho
Taiwanese
Male Disability
Male Disability Comparison
Arapaho
Taiwanese
13.3%
MALE DISABILITY
0.0/ 100
METRIC RATING
307th/ 347
METRIC RANK
10.3%
MALE DISABILITY
99.8/ 100
METRIC RATING
41st/ 347
METRIC RANK
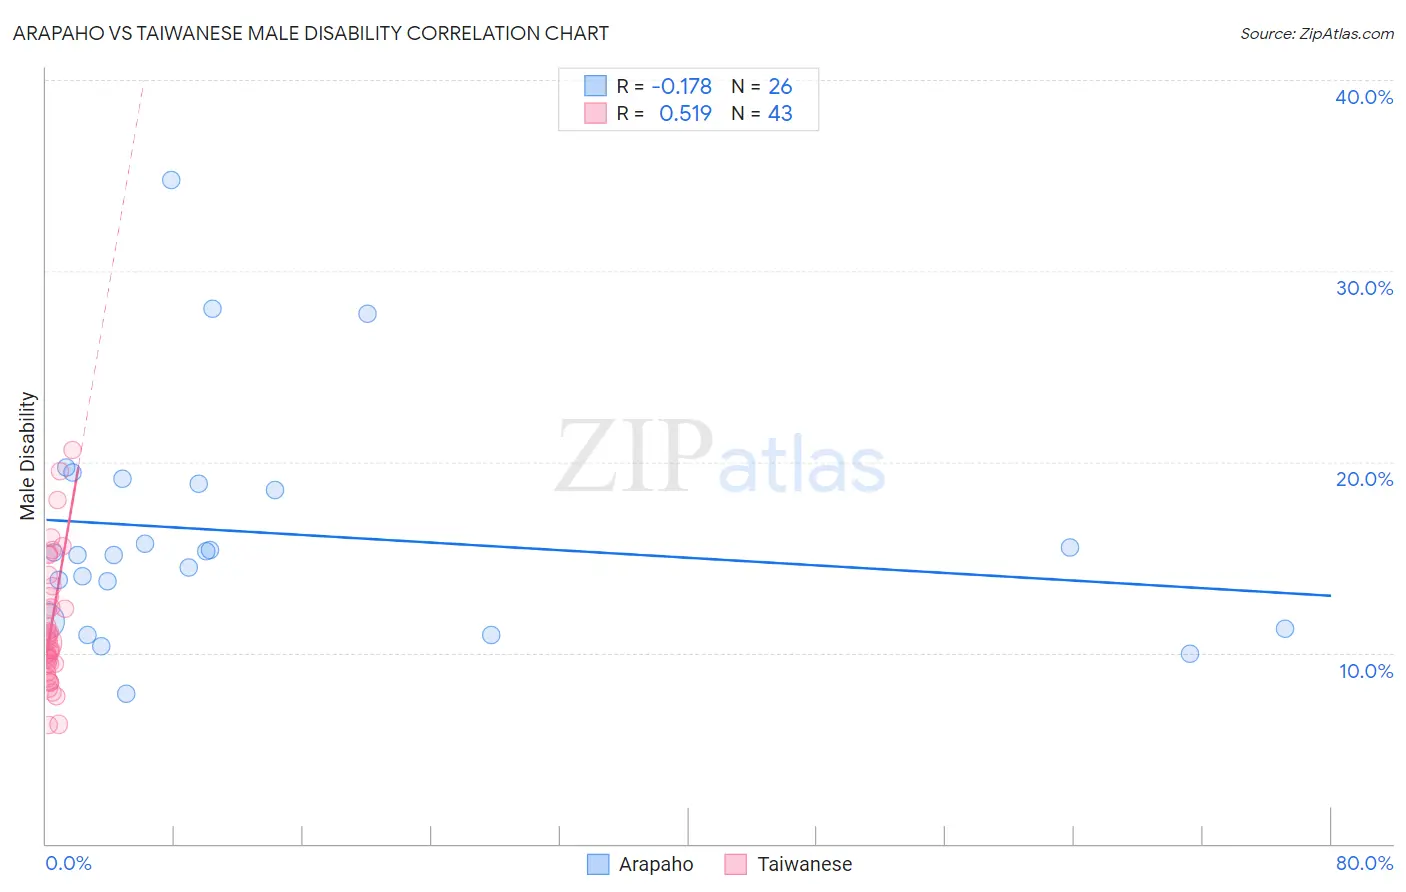
Arapaho vs Taiwanese Male Disability Correlation Chart
The statistical analysis conducted on geographies consisting of 29,780,236 people shows a poor negative correlation between the proportion of Arapaho and percentage of males with a disability in the United States with a correlation coefficient (R) of -0.178 and weighted average of 13.3%. Similarly, the statistical analysis conducted on geographies consisting of 31,723,465 people shows a substantial positive correlation between the proportion of Taiwanese and percentage of males with a disability in the United States with a correlation coefficient (R) of 0.519 and weighted average of 10.3%, a difference of 29.9%.
Male Disability Correlation Summary
| Measurement | Arapaho | Taiwanese |
| Minimum | 7.9% | 6.2% |
| Maximum | 34.7% | 20.6% |
| Range | 26.9% | 14.4% |
| Mean | 16.3% | 11.3% |
| Median | 15.2% | 10.5% |
| Interquartile 25% (IQ1) | 11.6% | 9.4% |
| Interquartile 75% (IQ3) | 18.8% | 12.9% |
| Interquartile Range (IQR) | 7.2% | 3.5% |
| Standard Deviation (Sample) | 6.1% | 3.3% |
| Standard Deviation (Population) | 6.0% | 3.3% |
Similar Demographics by Male Disability
Demographics Similar to Arapaho by Male Disability
In terms of male disability, the demographic groups most similar to Arapaho are French American Indian (13.4%, a difference of 0.15%), Spanish American (13.3%, a difference of 0.22%), French Canadian (13.3%, a difference of 0.42%), Blackfeet (13.4%, a difference of 0.58%), and Immigrants from the Azores (13.4%, a difference of 0.72%).
| Demographics | Rating | Rank | Male Disability |
| Cheyenne | 0.0 /100 | #300 | Tragic 13.0% |
| French | 0.0 /100 | #301 | Tragic 13.0% |
| Crow | 0.0 /100 | #302 | Tragic 13.1% |
| Scotch-Irish | 0.0 /100 | #303 | Tragic 13.2% |
| Blacks/African Americans | 0.0 /100 | #304 | Tragic 13.2% |
| French Canadians | 0.0 /100 | #305 | Tragic 13.3% |
| Spanish Americans | 0.0 /100 | #306 | Tragic 13.3% |
| Arapaho | 0.0 /100 | #307 | Tragic 13.3% |
| French American Indians | 0.0 /100 | #308 | Tragic 13.4% |
| Blackfeet | 0.0 /100 | #309 | Tragic 13.4% |
| Immigrants | Azores | 0.0 /100 | #310 | Tragic 13.4% |
| Delaware | 0.0 /100 | #311 | Tragic 13.5% |
| Yakama | 0.0 /100 | #312 | Tragic 13.5% |
| Puget Sound Salish | 0.0 /100 | #313 | Tragic 13.5% |
| Aleuts | 0.0 /100 | #314 | Tragic 13.5% |
Demographics Similar to Taiwanese by Male Disability
In terms of male disability, the demographic groups most similar to Taiwanese are Immigrants from Nepal (10.3%, a difference of 0.0%), Afghan (10.2%, a difference of 0.19%), Mongolian (10.3%, a difference of 0.25%), Immigrants from Bangladesh (10.3%, a difference of 0.27%), and Immigrants from Kuwait (10.2%, a difference of 0.35%).
| Demographics | Rating | Rank | Male Disability |
| Immigrants | Turkey | 99.9 /100 | #34 | Exceptional 10.2% |
| Immigrants | Argentina | 99.9 /100 | #35 | Exceptional 10.2% |
| Ethiopians | 99.8 /100 | #36 | Exceptional 10.2% |
| Immigrants | Indonesia | 99.8 /100 | #37 | Exceptional 10.2% |
| Immigrants | Kuwait | 99.8 /100 | #38 | Exceptional 10.2% |
| Afghans | 99.8 /100 | #39 | Exceptional 10.2% |
| Immigrants | Nepal | 99.8 /100 | #40 | Exceptional 10.3% |
| Taiwanese | 99.8 /100 | #41 | Exceptional 10.3% |
| Mongolians | 99.7 /100 | #42 | Exceptional 10.3% |
| Immigrants | Bangladesh | 99.7 /100 | #43 | Exceptional 10.3% |
| Immigrants | El Salvador | 99.7 /100 | #44 | Exceptional 10.3% |
| Turks | 99.7 /100 | #45 | Exceptional 10.3% |
| Cambodians | 99.7 /100 | #46 | Exceptional 10.3% |
| Immigrants | Peru | 99.7 /100 | #47 | Exceptional 10.3% |
| Israelis | 99.7 /100 | #48 | Exceptional 10.3% |