Arab vs South African Unemployment Among Youth under 25 years
COMPARE
Arab
South African
Unemployment Among Youth under 25 years
Unemployment Among Youth under 25 years Comparison
Arabs
South Africans
11.8%
UNEMPLOYMENT AMONG YOUTH UNDER 25 YEARS
18.0/ 100
METRIC RATING
200th/ 347
METRIC RANK
11.1%
UNEMPLOYMENT AMONG YOUTH UNDER 25 YEARS
98.5/ 100
METRIC RATING
60th/ 347
METRIC RANK
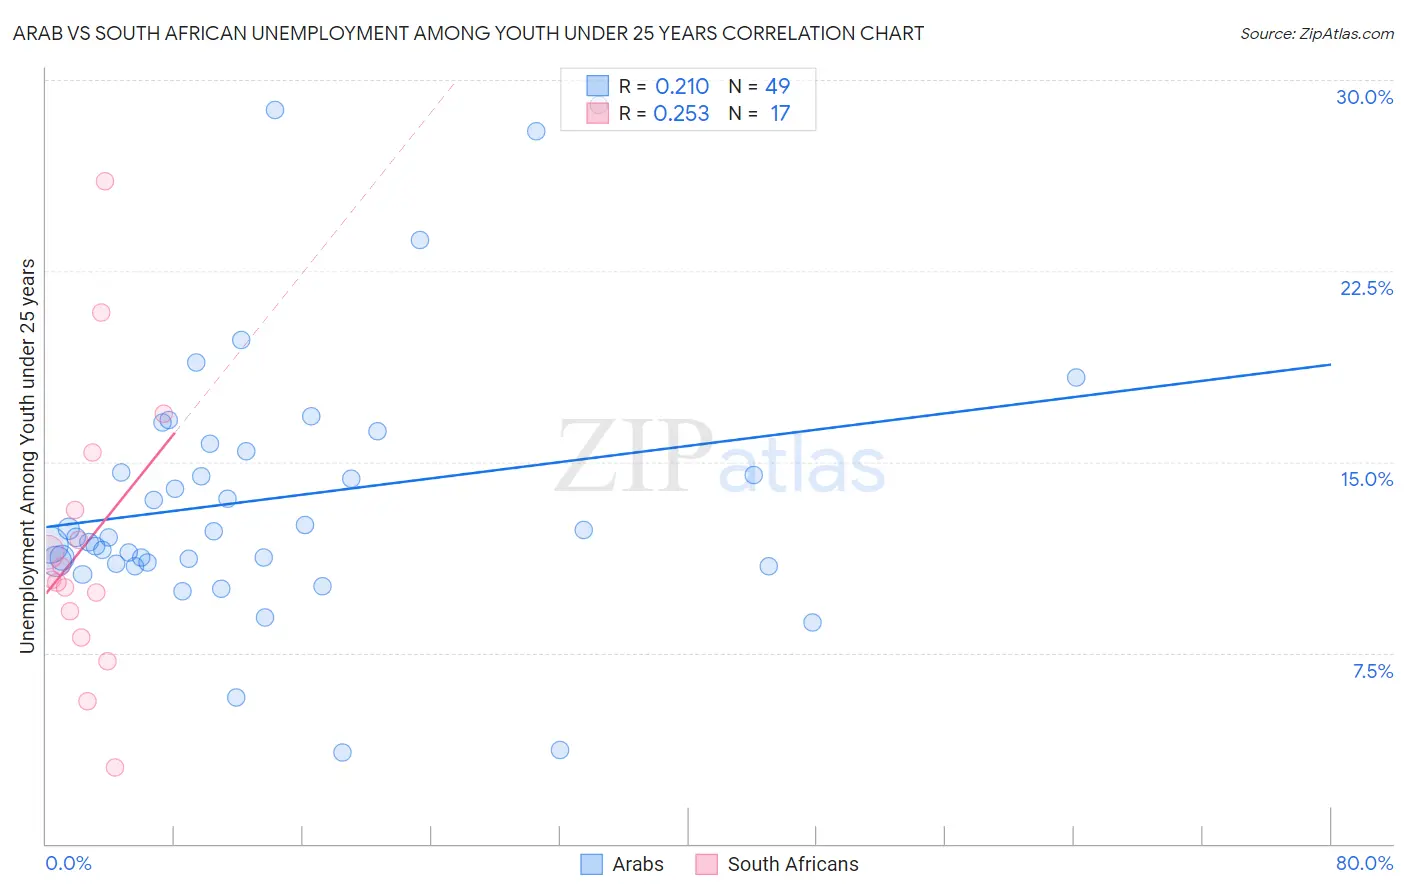
Arab vs South African Unemployment Among Youth under 25 years Correlation Chart
The statistical analysis conducted on geographies consisting of 478,049,168 people shows a weak positive correlation between the proportion of Arabs and unemployment rate among youth under the age of 25 in the United States with a correlation coefficient (R) of 0.210 and weighted average of 11.8%. Similarly, the statistical analysis conducted on geographies consisting of 181,476,812 people shows a weak positive correlation between the proportion of South Africans and unemployment rate among youth under the age of 25 in the United States with a correlation coefficient (R) of 0.253 and weighted average of 11.1%, a difference of 6.1%.
Unemployment Among Youth under 25 years Correlation Summary
| Measurement | Arab | South African |
| Minimum | 3.6% | 3.0% |
| Maximum | 29.0% | 26.0% |
| Range | 25.4% | 23.0% |
| Mean | 13.6% | 11.8% |
| Median | 12.0% | 10.4% |
| Interquartile 25% (IQ1) | 11.0% | 8.6% |
| Interquartile 75% (IQ3) | 15.6% | 14.2% |
| Interquartile Range (IQR) | 4.5% | 5.6% |
| Standard Deviation (Sample) | 5.3% | 5.6% |
| Standard Deviation (Population) | 5.3% | 5.4% |
Similar Demographics by Unemployment Among Youth under 25 years
Demographics Similar to Arabs by Unemployment Among Youth under 25 years
In terms of unemployment among youth under 25 years, the demographic groups most similar to Arabs are Palestinian (11.8%, a difference of 0.15%), Marshallese (11.8%, a difference of 0.16%), Immigrants from Colombia (11.8%, a difference of 0.19%), Cherokee (11.8%, a difference of 0.20%), and Immigrants from Peru (11.8%, a difference of 0.20%).
| Demographics | Rating | Rank | Unemployment Among Youth under 25 years |
| Seminole | 27.9 /100 | #193 | Fair 11.7% |
| Immigrants | Sri Lanka | 27.8 /100 | #194 | Fair 11.7% |
| Paraguayans | 27.2 /100 | #195 | Fair 11.7% |
| Egyptians | 26.9 /100 | #196 | Fair 11.7% |
| Koreans | 23.9 /100 | #197 | Fair 11.7% |
| Cherokee | 21.2 /100 | #198 | Fair 11.8% |
| Immigrants | Colombia | 20.9 /100 | #199 | Fair 11.8% |
| Arabs | 18.0 /100 | #200 | Poor 11.8% |
| Palestinians | 16.0 /100 | #201 | Poor 11.8% |
| Marshallese | 15.8 /100 | #202 | Poor 11.8% |
| Immigrants | Peru | 15.3 /100 | #203 | Poor 11.8% |
| Immigrants | Costa Rica | 15.2 /100 | #204 | Poor 11.8% |
| Peruvians | 14.0 /100 | #205 | Poor 11.8% |
| Immigrants | Pakistan | 12.6 /100 | #206 | Poor 11.8% |
| Immigrants | Southern Europe | 12.3 /100 | #207 | Poor 11.8% |
Demographics Similar to South Africans by Unemployment Among Youth under 25 years
In terms of unemployment among youth under 25 years, the demographic groups most similar to South Africans are Immigrants from Eastern Africa (11.1%, a difference of 0.16%), Filipino (11.1%, a difference of 0.18%), Scotch-Irish (11.1%, a difference of 0.21%), Immigrants from Eritrea (11.1%, a difference of 0.25%), and Immigrants from Saudi Arabia (11.1%, a difference of 0.26%).
| Demographics | Rating | Rank | Unemployment Among Youth under 25 years |
| Ottawa | 99.0 /100 | #53 | Exceptional 11.1% |
| Mongolians | 98.9 /100 | #54 | Exceptional 11.1% |
| Irish | 98.9 /100 | #55 | Exceptional 11.1% |
| Immigrants | Saudi Arabia | 98.8 /100 | #56 | Exceptional 11.1% |
| Immigrants | Eritrea | 98.8 /100 | #57 | Exceptional 11.1% |
| Scotch-Irish | 98.8 /100 | #58 | Exceptional 11.1% |
| Immigrants | Eastern Africa | 98.7 /100 | #59 | Exceptional 11.1% |
| South Africans | 98.5 /100 | #60 | Exceptional 11.1% |
| Filipinos | 98.3 /100 | #61 | Exceptional 11.1% |
| Immigrants | Netherlands | 98.1 /100 | #62 | Exceptional 11.1% |
| Immigrants | Croatia | 98.1 /100 | #63 | Exceptional 11.1% |
| Jordanians | 97.9 /100 | #64 | Exceptional 11.1% |
| Immigrants | Singapore | 97.8 /100 | #65 | Exceptional 11.2% |
| Macedonians | 97.7 /100 | #66 | Exceptional 11.2% |
| Chickasaw | 97.7 /100 | #67 | Exceptional 11.2% |