Apache vs Maltese Disability Age Over 75
COMPARE
Apache
Maltese
Disability Age Over 75
Disability Age Over 75 Comparison
Apache
Maltese
53.6%
DISABILITY AGE OVER 75
0.0/ 100
METRIC RATING
333rd/ 347
METRIC RANK
45.8%
DISABILITY AGE OVER 75
99.6/ 100
METRIC RATING
55th/ 347
METRIC RANK
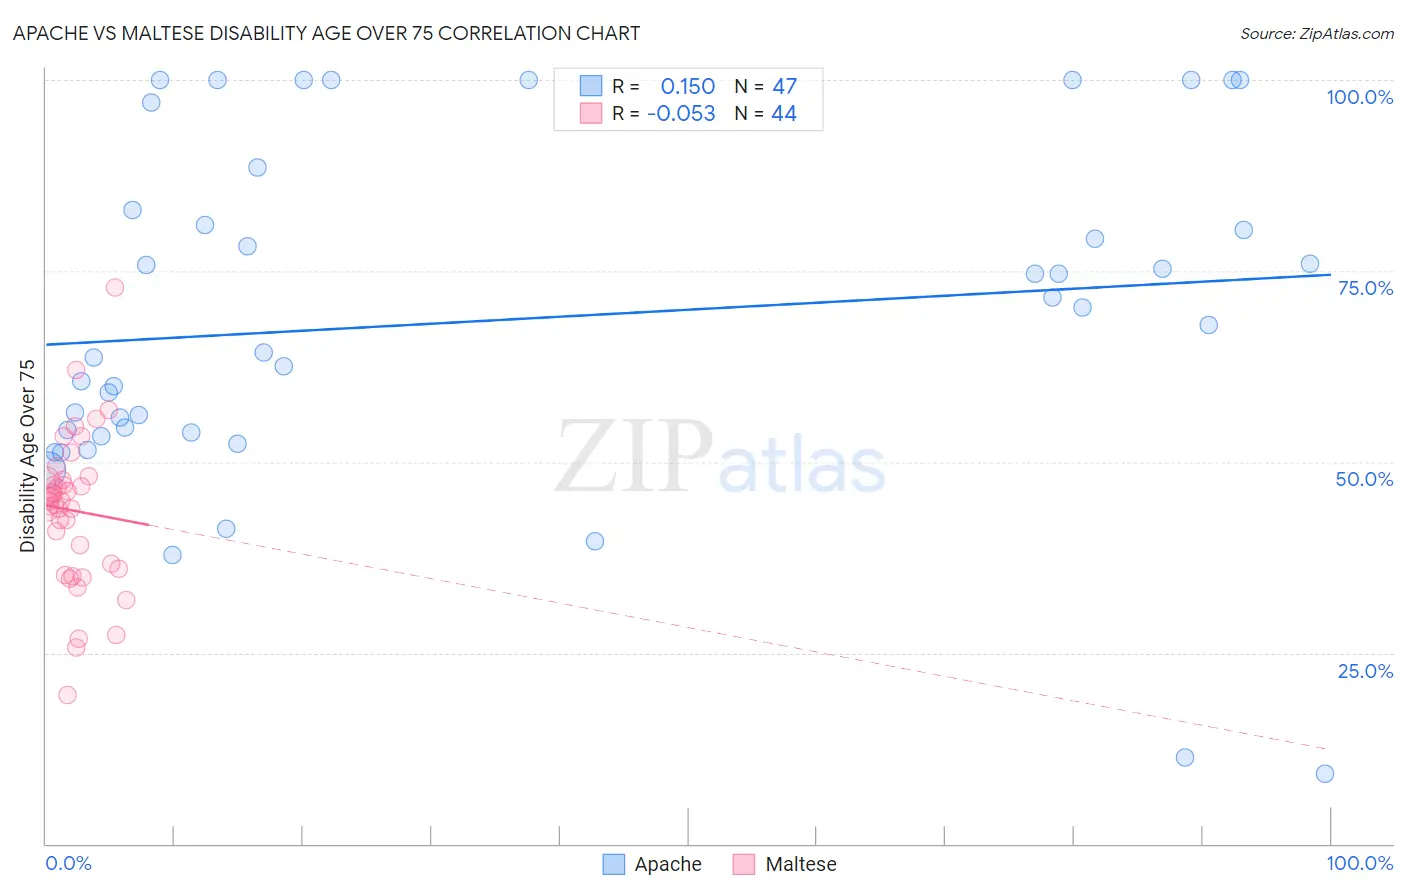
Apache vs Maltese Disability Age Over 75 Correlation Chart
The statistical analysis conducted on geographies consisting of 230,788,811 people shows a poor positive correlation between the proportion of Apache and percentage of population with a disability over the age of 75 in the United States with a correlation coefficient (R) of 0.150 and weighted average of 53.6%. Similarly, the statistical analysis conducted on geographies consisting of 126,418,061 people shows a slight negative correlation between the proportion of Maltese and percentage of population with a disability over the age of 75 in the United States with a correlation coefficient (R) of -0.053 and weighted average of 45.8%, a difference of 16.9%.
Disability Age Over 75 Correlation Summary
| Measurement | Apache | Maltese |
| Minimum | 9.1% | 19.4% |
| Maximum | 100.0% | 72.8% |
| Range | 90.9% | 53.3% |
| Mean | 68.6% | 43.6% |
| Median | 68.0% | 44.8% |
| Interquartile 25% (IQ1) | 53.8% | 36.4% |
| Interquartile 75% (IQ3) | 83.0% | 47.7% |
| Interquartile Range (IQR) | 29.2% | 11.3% |
| Standard Deviation (Sample) | 22.6% | 9.8% |
| Standard Deviation (Population) | 22.4% | 9.7% |
Similar Demographics by Disability Age Over 75
Demographics Similar to Apache by Disability Age Over 75
In terms of disability age over 75, the demographic groups most similar to Apache are Alaskan Athabascan (54.0%, a difference of 0.67%), Native/Alaskan (53.1%, a difference of 1.0%), Kiowa (54.2%, a difference of 1.2%), Hopi (52.9%, a difference of 1.3%), and Puerto Rican (52.9%, a difference of 1.3%).
| Demographics | Rating | Rank | Disability Age Over 75 |
| Ute | 0.0 /100 | #326 | Tragic 52.6% |
| Nepalese | 0.0 /100 | #327 | Tragic 52.6% |
| Choctaw | 0.0 /100 | #328 | Tragic 52.7% |
| Alaska Natives | 0.0 /100 | #329 | Tragic 52.8% |
| Puerto Ricans | 0.0 /100 | #330 | Tragic 52.9% |
| Hopi | 0.0 /100 | #331 | Tragic 52.9% |
| Natives/Alaskans | 0.0 /100 | #332 | Tragic 53.1% |
| Apache | 0.0 /100 | #333 | Tragic 53.6% |
| Alaskan Athabascans | 0.0 /100 | #334 | Tragic 54.0% |
| Kiowa | 0.0 /100 | #335 | Tragic 54.2% |
| Immigrants | Armenia | 0.0 /100 | #336 | Tragic 54.3% |
| Yuman | 0.0 /100 | #337 | Tragic 54.4% |
| Colville | 0.0 /100 | #338 | Tragic 55.4% |
| Pima | 0.0 /100 | #339 | Tragic 55.8% |
| Pueblo | 0.0 /100 | #340 | Tragic 55.9% |
Demographics Similar to Maltese by Disability Age Over 75
In terms of disability age over 75, the demographic groups most similar to Maltese are Slovak (45.8%, a difference of 0.0%), Immigrants from Netherlands (45.9%, a difference of 0.070%), Immigrants from Italy (45.8%, a difference of 0.080%), Immigrants from Turkey (45.9%, a difference of 0.080%), and Immigrants from Israel (45.9%, a difference of 0.080%).
| Demographics | Rating | Rank | Disability Age Over 75 |
| Croatians | 99.8 /100 | #48 | Exceptional 45.7% |
| Immigrants | North America | 99.8 /100 | #49 | Exceptional 45.7% |
| Belgians | 99.7 /100 | #50 | Exceptional 45.8% |
| Immigrants | Korea | 99.7 /100 | #51 | Exceptional 45.8% |
| Immigrants | France | 99.7 /100 | #52 | Exceptional 45.8% |
| Immigrants | Italy | 99.7 /100 | #53 | Exceptional 45.8% |
| Slovaks | 99.6 /100 | #54 | Exceptional 45.8% |
| Maltese | 99.6 /100 | #55 | Exceptional 45.8% |
| Immigrants | Netherlands | 99.6 /100 | #56 | Exceptional 45.9% |
| Immigrants | Turkey | 99.6 /100 | #57 | Exceptional 45.9% |
| Immigrants | Israel | 99.6 /100 | #58 | Exceptional 45.9% |
| Iranians | 99.6 /100 | #59 | Exceptional 45.9% |
| Immigrants | Europe | 99.6 /100 | #60 | Exceptional 45.9% |
| Immigrants | Argentina | 99.6 /100 | #61 | Exceptional 45.9% |
| Burmese | 99.5 /100 | #62 | Exceptional 45.9% |