Apache vs Vietnamese Female Disability
COMPARE
Apache
Vietnamese
Female Disability
Female Disability Comparison
Apache
Vietnamese
13.7%
FEMALE DISABILITY
0.0/ 100
METRIC RATING
310th/ 347
METRIC RANK
11.6%
FEMALE DISABILITY
99.5/ 100
METRIC RATING
89th/ 347
METRIC RANK
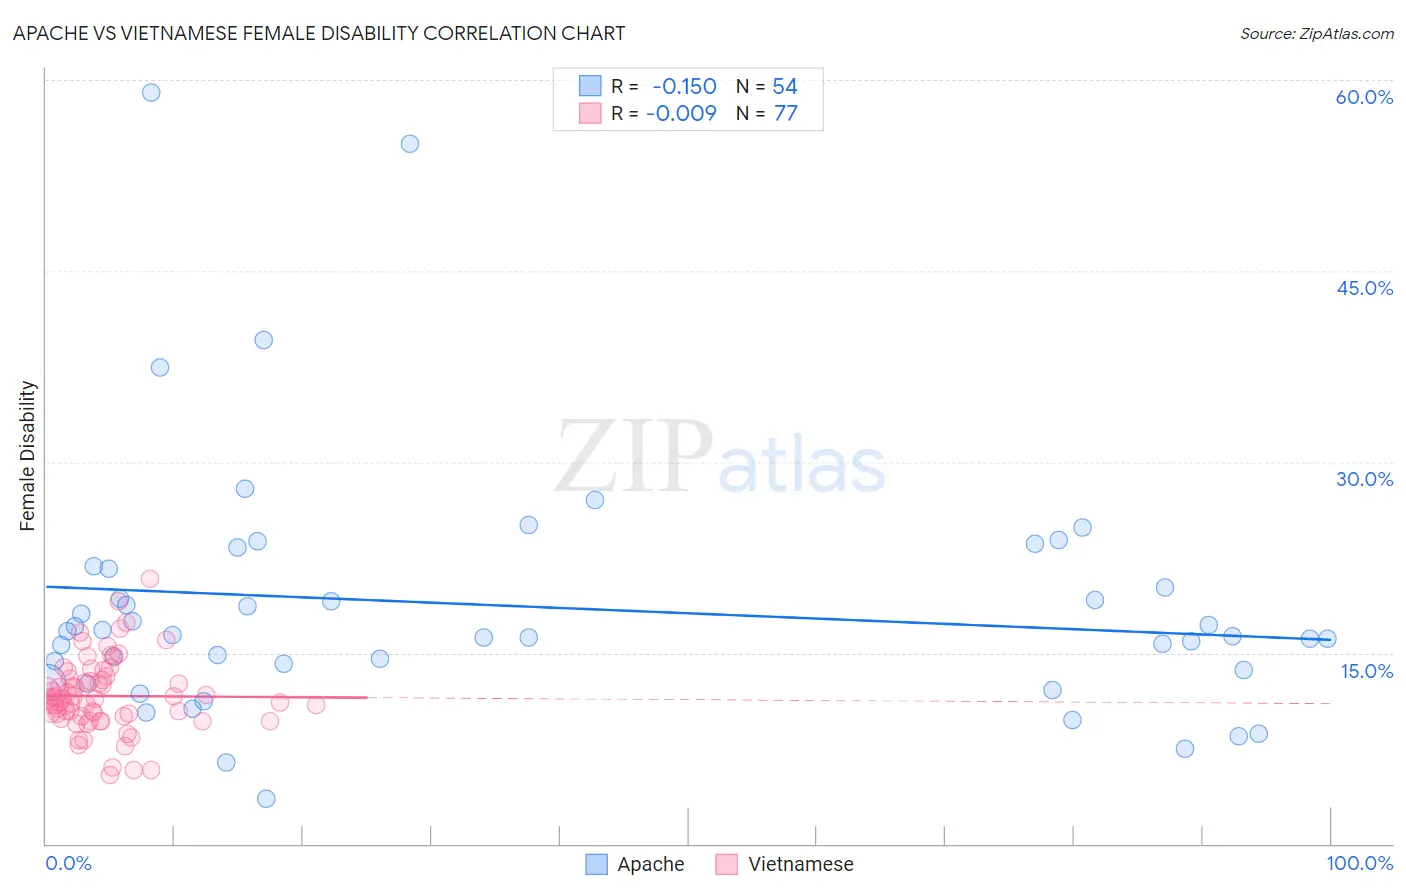
Apache vs Vietnamese Female Disability Correlation Chart
The statistical analysis conducted on geographies consisting of 231,061,138 people shows a poor negative correlation between the proportion of Apache and percentage of females with a disability in the United States with a correlation coefficient (R) of -0.150 and weighted average of 13.7%. Similarly, the statistical analysis conducted on geographies consisting of 170,755,958 people shows no correlation between the proportion of Vietnamese and percentage of females with a disability in the United States with a correlation coefficient (R) of -0.009 and weighted average of 11.6%, a difference of 18.3%.
Female Disability Correlation Summary
| Measurement | Apache | Vietnamese |
| Minimum | 3.6% | 5.4% |
| Maximum | 59.0% | 20.8% |
| Range | 55.5% | 15.5% |
| Mean | 18.7% | 11.6% |
| Median | 16.3% | 11.3% |
| Interquartile 25% (IQ1) | 13.7% | 10.0% |
| Interquartile 75% (IQ3) | 21.6% | 12.9% |
| Interquartile Range (IQR) | 7.9% | 2.9% |
| Standard Deviation (Sample) | 10.1% | 2.9% |
| Standard Deviation (Population) | 10.0% | 2.8% |
Similar Demographics by Female Disability
Demographics Similar to Apache by Female Disability
In terms of female disability, the demographic groups most similar to Apache are French American Indian (13.7%, a difference of 0.12%), Cree (13.7%, a difference of 0.18%), Hopi (13.7%, a difference of 0.29%), Delaware (13.8%, a difference of 0.60%), and Central American Indian (13.6%, a difference of 0.63%).
| Demographics | Rating | Rank | Female Disability |
| Immigrants | Portugal | 0.0 /100 | #303 | Tragic 13.5% |
| Immigrants | Micronesia | 0.0 /100 | #304 | Tragic 13.5% |
| Dominicans | 0.0 /100 | #305 | Tragic 13.5% |
| French Canadians | 0.0 /100 | #306 | Tragic 13.6% |
| Central American Indians | 0.0 /100 | #307 | Tragic 13.6% |
| Cree | 0.0 /100 | #308 | Tragic 13.7% |
| French American Indians | 0.0 /100 | #309 | Tragic 13.7% |
| Apache | 0.0 /100 | #310 | Tragic 13.7% |
| Hopi | 0.0 /100 | #311 | Tragic 13.7% |
| Delaware | 0.0 /100 | #312 | Tragic 13.8% |
| Blackfeet | 0.0 /100 | #313 | Tragic 13.8% |
| Puget Sound Salish | 0.0 /100 | #314 | Tragic 13.8% |
| Alaskan Athabascans | 0.0 /100 | #315 | Tragic 13.9% |
| Spanish Americans | 0.0 /100 | #316 | Tragic 14.0% |
| Chippewa | 0.0 /100 | #317 | Tragic 14.0% |
Demographics Similar to Vietnamese by Female Disability
In terms of female disability, the demographic groups most similar to Vietnamese are Immigrants from Romania (11.6%, a difference of 0.010%), Immigrants from Zimbabwe (11.6%, a difference of 0.010%), Immigrants from Czechoslovakia (11.6%, a difference of 0.020%), Immigrants from Denmark (11.6%, a difference of 0.10%), and Yup'ik (11.6%, a difference of 0.10%).
| Demographics | Rating | Rank | Female Disability |
| Luxembourgers | 99.6 /100 | #82 | Exceptional 11.6% |
| Immigrants | Serbia | 99.6 /100 | #83 | Exceptional 11.6% |
| Immigrants | Poland | 99.6 /100 | #84 | Exceptional 11.6% |
| Palestinians | 99.6 /100 | #85 | Exceptional 11.6% |
| Immigrants | Cameroon | 99.6 /100 | #86 | Exceptional 11.6% |
| Immigrants | Denmark | 99.5 /100 | #87 | Exceptional 11.6% |
| Yup'ik | 99.5 /100 | #88 | Exceptional 11.6% |
| Vietnamese | 99.5 /100 | #89 | Exceptional 11.6% |
| Immigrants | Romania | 99.5 /100 | #90 | Exceptional 11.6% |
| Immigrants | Zimbabwe | 99.5 /100 | #91 | Exceptional 11.6% |
| Immigrants | Czechoslovakia | 99.5 /100 | #92 | Exceptional 11.6% |
| Immigrants | Sierra Leone | 99.4 /100 | #93 | Exceptional 11.6% |
| Immigrants | Brazil | 99.4 /100 | #94 | Exceptional 11.6% |
| Immigrants | Northern Europe | 99.4 /100 | #95 | Exceptional 11.6% |
| Immigrants | Russia | 99.0 /100 | #96 | Exceptional 11.7% |