Apache vs Sri Lankan Female Disability
COMPARE
Apache
Sri Lankan
Female Disability
Female Disability Comparison
Apache
Sri Lankans
13.7%
FEMALE DISABILITY
0.0/ 100
METRIC RATING
310th/ 347
METRIC RANK
11.4%
FEMALE DISABILITY
99.9/ 100
METRIC RATING
62nd/ 347
METRIC RANK
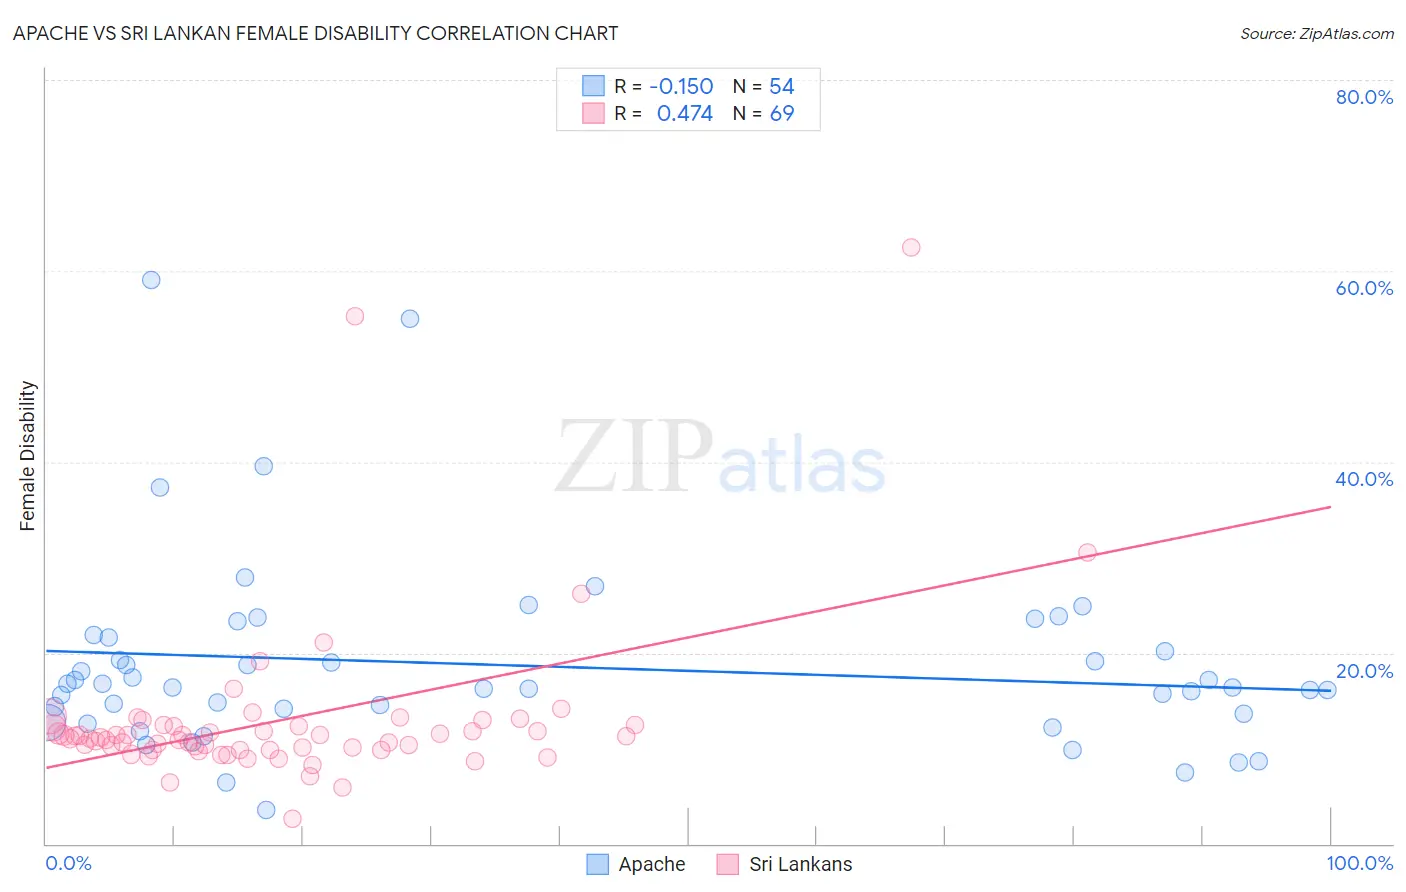
Apache vs Sri Lankan Female Disability Correlation Chart
The statistical analysis conducted on geographies consisting of 231,061,138 people shows a poor negative correlation between the proportion of Apache and percentage of females with a disability in the United States with a correlation coefficient (R) of -0.150 and weighted average of 13.7%. Similarly, the statistical analysis conducted on geographies consisting of 440,479,567 people shows a moderate positive correlation between the proportion of Sri Lankans and percentage of females with a disability in the United States with a correlation coefficient (R) of 0.474 and weighted average of 11.4%, a difference of 20.0%.
Female Disability Correlation Summary
| Measurement | Apache | Sri Lankan |
| Minimum | 3.6% | 2.6% |
| Maximum | 59.0% | 62.5% |
| Range | 55.5% | 59.9% |
| Mean | 18.7% | 12.9% |
| Median | 16.3% | 11.2% |
| Interquartile 25% (IQ1) | 13.7% | 9.8% |
| Interquartile 75% (IQ3) | 21.6% | 12.4% |
| Interquartile Range (IQR) | 7.9% | 2.5% |
| Standard Deviation (Sample) | 10.1% | 8.9% |
| Standard Deviation (Population) | 10.0% | 8.9% |
Similar Demographics by Female Disability
Demographics Similar to Apache by Female Disability
In terms of female disability, the demographic groups most similar to Apache are French American Indian (13.7%, a difference of 0.12%), Cree (13.7%, a difference of 0.18%), Hopi (13.7%, a difference of 0.29%), Delaware (13.8%, a difference of 0.60%), and Central American Indian (13.6%, a difference of 0.63%).
| Demographics | Rating | Rank | Female Disability |
| Immigrants | Portugal | 0.0 /100 | #303 | Tragic 13.5% |
| Immigrants | Micronesia | 0.0 /100 | #304 | Tragic 13.5% |
| Dominicans | 0.0 /100 | #305 | Tragic 13.5% |
| French Canadians | 0.0 /100 | #306 | Tragic 13.6% |
| Central American Indians | 0.0 /100 | #307 | Tragic 13.6% |
| Cree | 0.0 /100 | #308 | Tragic 13.7% |
| French American Indians | 0.0 /100 | #309 | Tragic 13.7% |
| Apache | 0.0 /100 | #310 | Tragic 13.7% |
| Hopi | 0.0 /100 | #311 | Tragic 13.7% |
| Delaware | 0.0 /100 | #312 | Tragic 13.8% |
| Blackfeet | 0.0 /100 | #313 | Tragic 13.8% |
| Puget Sound Salish | 0.0 /100 | #314 | Tragic 13.8% |
| Alaskan Athabascans | 0.0 /100 | #315 | Tragic 13.9% |
| Spanish Americans | 0.0 /100 | #316 | Tragic 14.0% |
| Chippewa | 0.0 /100 | #317 | Tragic 14.0% |
Demographics Similar to Sri Lankans by Female Disability
In terms of female disability, the demographic groups most similar to Sri Lankans are Immigrants from France (11.4%, a difference of 0.10%), Immigrants from Colombia (11.4%, a difference of 0.10%), Immigrants from Bulgaria (11.4%, a difference of 0.15%), Immigrants from El Salvador (11.4%, a difference of 0.17%), and Immigrants from South America (11.4%, a difference of 0.19%).
| Demographics | Rating | Rank | Female Disability |
| Bulgarians | 99.9 /100 | #55 | Exceptional 11.3% |
| Taiwanese | 99.9 /100 | #56 | Exceptional 11.4% |
| South Americans | 99.9 /100 | #57 | Exceptional 11.4% |
| Laotians | 99.9 /100 | #58 | Exceptional 11.4% |
| Immigrants | Spain | 99.9 /100 | #59 | Exceptional 11.4% |
| Immigrants | Bulgaria | 99.9 /100 | #60 | Exceptional 11.4% |
| Immigrants | France | 99.9 /100 | #61 | Exceptional 11.4% |
| Sri Lankans | 99.9 /100 | #62 | Exceptional 11.4% |
| Immigrants | Colombia | 99.9 /100 | #63 | Exceptional 11.4% |
| Immigrants | El Salvador | 99.9 /100 | #64 | Exceptional 11.4% |
| Immigrants | South America | 99.9 /100 | #65 | Exceptional 11.4% |
| Salvadorans | 99.8 /100 | #66 | Exceptional 11.5% |
| Immigrants | Vietnam | 99.8 /100 | #67 | Exceptional 11.5% |
| Immigrants | Northern Africa | 99.8 /100 | #68 | Exceptional 11.5% |
| Colombians | 99.8 /100 | #69 | Exceptional 11.5% |