Bermudan vs Immigrants from Costa Rica Ambulatory Disability
COMPARE
Bermudan
Immigrants from Costa Rica
Ambulatory Disability
Ambulatory Disability Comparison
Bermudans
Immigrants from Costa Rica
6.5%
AMBULATORY DISABILITY
0.5/ 100
METRIC RATING
257th/ 347
METRIC RANK
5.9%
AMBULATORY DISABILITY
89.5/ 100
METRIC RATING
131st/ 347
METRIC RANK
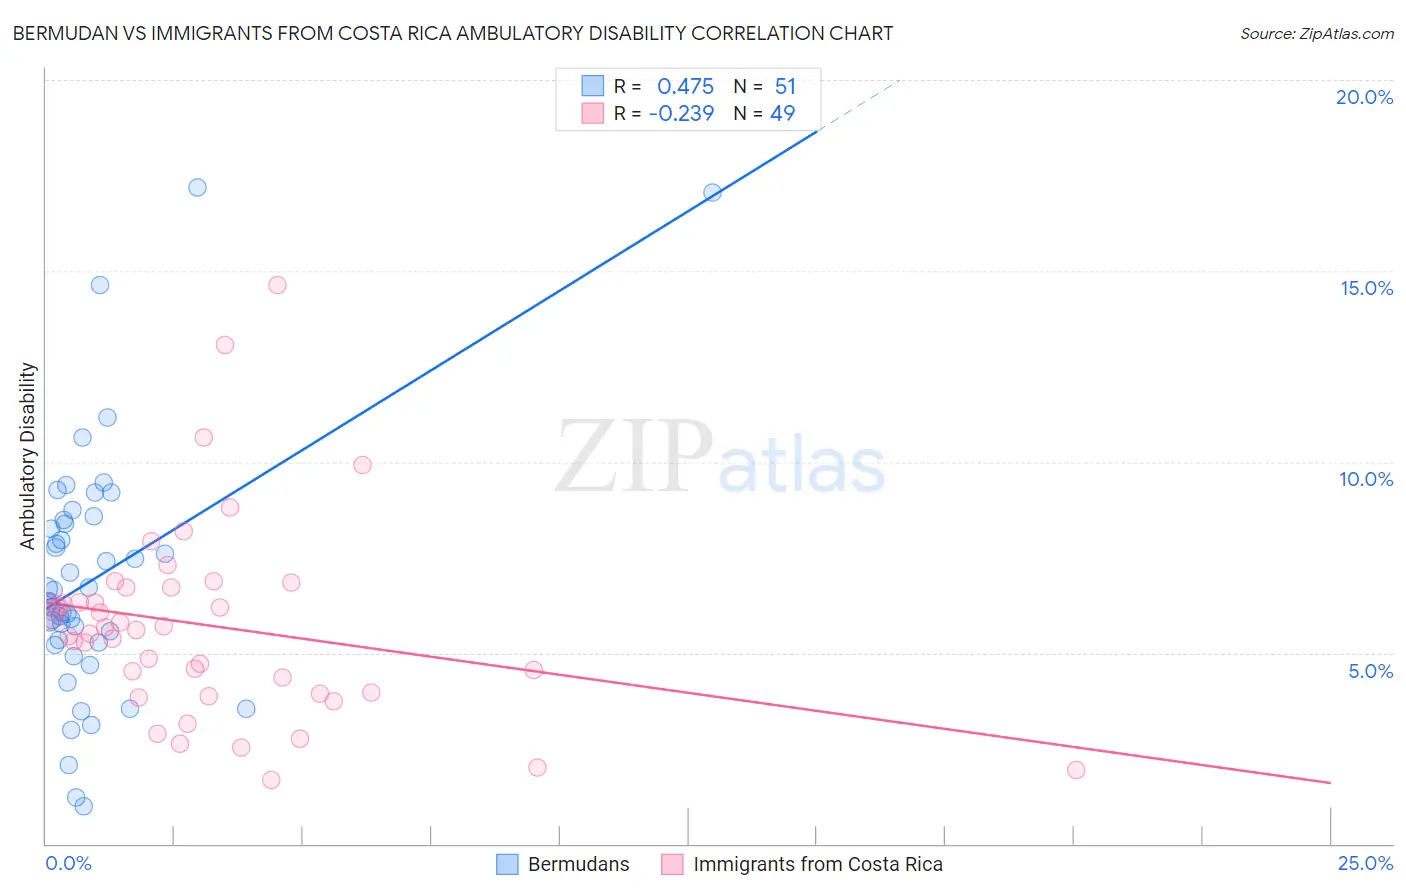
Bermudan vs Immigrants from Costa Rica Ambulatory Disability Correlation Chart
The statistical analysis conducted on geographies consisting of 55,721,081 people shows a moderate positive correlation between the proportion of Bermudans and percentage of population with ambulatory disability in the United States with a correlation coefficient (R) of 0.475 and weighted average of 6.5%. Similarly, the statistical analysis conducted on geographies consisting of 204,267,937 people shows a weak negative correlation between the proportion of Immigrants from Costa Rica and percentage of population with ambulatory disability in the United States with a correlation coefficient (R) of -0.239 and weighted average of 5.9%, a difference of 10.0%.
Ambulatory Disability Correlation Summary
| Measurement | Bermudan | Immigrants from Costa Rica |
| Minimum | 0.98% | 1.7% |
| Maximum | 17.2% | 14.6% |
| Range | 16.2% | 13.0% |
| Mean | 7.0% | 5.7% |
| Median | 6.4% | 5.6% |
| Interquartile 25% (IQ1) | 5.3% | 4.0% |
| Interquartile 75% (IQ3) | 8.5% | 6.7% |
| Interquartile Range (IQR) | 3.2% | 2.8% |
| Standard Deviation (Sample) | 3.3% | 2.6% |
| Standard Deviation (Population) | 3.2% | 2.6% |
Similar Demographics by Ambulatory Disability
Demographics Similar to Bermudans by Ambulatory Disability
In terms of ambulatory disability, the demographic groups most similar to Bermudans are Immigrants from Uzbekistan (6.5%, a difference of 0.080%), Spanish American Indian (6.5%, a difference of 0.080%), Welsh (6.5%, a difference of 0.16%), Belizean (6.5%, a difference of 0.23%), and Aleut (6.6%, a difference of 0.26%).
| Demographics | Rating | Rank | Ambulatory Disability |
| Chinese | 1.0 /100 | #250 | Tragic 6.5% |
| Hawaiians | 0.9 /100 | #251 | Tragic 6.5% |
| Immigrants | Bahamas | 0.8 /100 | #252 | Tragic 6.5% |
| Scottish | 0.7 /100 | #253 | Tragic 6.5% |
| Belizeans | 0.7 /100 | #254 | Tragic 6.5% |
| Welsh | 0.6 /100 | #255 | Tragic 6.5% |
| Immigrants | Uzbekistan | 0.6 /100 | #256 | Tragic 6.5% |
| Bermudans | 0.5 /100 | #257 | Tragic 6.5% |
| Spanish American Indians | 0.5 /100 | #258 | Tragic 6.5% |
| Aleuts | 0.4 /100 | #259 | Tragic 6.6% |
| Immigrants | Belize | 0.4 /100 | #260 | Tragic 6.6% |
| Irish | 0.4 /100 | #261 | Tragic 6.6% |
| English | 0.4 /100 | #262 | Tragic 6.6% |
| Hmong | 0.3 /100 | #263 | Tragic 6.6% |
| Nepalese | 0.2 /100 | #264 | Tragic 6.6% |
Demographics Similar to Immigrants from Costa Rica by Ambulatory Disability
In terms of ambulatory disability, the demographic groups most similar to Immigrants from Costa Rica are Immigrants from Kazakhstan (5.9%, a difference of 0.030%), Immigrants from Norway (5.9%, a difference of 0.14%), Immigrants from Western Asia (5.9%, a difference of 0.17%), Immigrants from Nigeria (5.9%, a difference of 0.21%), and Immigrants from Europe (6.0%, a difference of 0.24%).
| Demographics | Rating | Rank | Ambulatory Disability |
| Immigrants | Middle Africa | 92.2 /100 | #124 | Exceptional 5.9% |
| Koreans | 91.6 /100 | #125 | Exceptional 5.9% |
| Arabs | 91.5 /100 | #126 | Exceptional 5.9% |
| Immigrants | Nigeria | 90.9 /100 | #127 | Exceptional 5.9% |
| Immigrants | Western Asia | 90.7 /100 | #128 | Exceptional 5.9% |
| Immigrants | Norway | 90.5 /100 | #129 | Exceptional 5.9% |
| Immigrants | Kazakhstan | 89.7 /100 | #130 | Excellent 5.9% |
| Immigrants | Costa Rica | 89.5 /100 | #131 | Excellent 5.9% |
| Immigrants | Europe | 87.8 /100 | #132 | Excellent 6.0% |
| Immigrants | Immigrants | 86.9 /100 | #133 | Excellent 6.0% |
| Ute | 86.6 /100 | #134 | Excellent 6.0% |
| Immigrants | Italy | 85.0 /100 | #135 | Excellent 6.0% |
| Immigrants | North Macedonia | 84.1 /100 | #136 | Excellent 6.0% |
| Immigrants | Syria | 84.1 /100 | #137 | Excellent 6.0% |
| Immigrants | Hungary | 83.9 /100 | #138 | Excellent 6.0% |