Dominican vs Immigrants from Bosnia and Herzegovina Vision Disability
COMPARE
Dominican
Immigrants from Bosnia and Herzegovina
Vision Disability
Vision Disability Comparison
Dominicans
Immigrants from Bosnia and Herzegovina
2.6%
VISION DISABILITY
0.0/ 100
METRIC RATING
311th/ 347
METRIC RANK
2.1%
VISION DISABILITY
81.5/ 100
METRIC RATING
145th/ 347
METRIC RANK
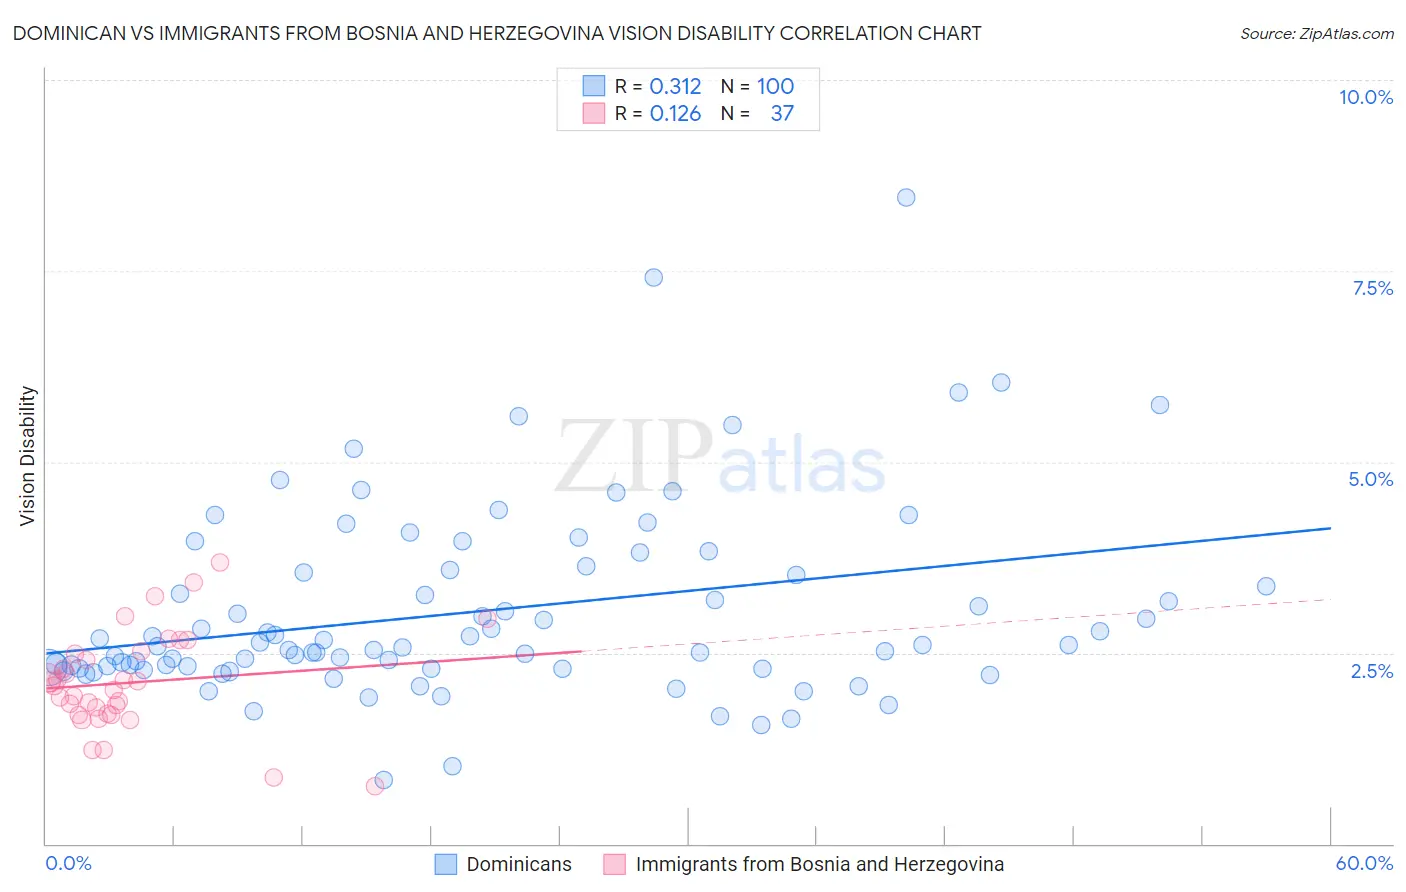
Dominican vs Immigrants from Bosnia and Herzegovina Vision Disability Correlation Chart
The statistical analysis conducted on geographies consisting of 354,764,822 people shows a mild positive correlation between the proportion of Dominicans and percentage of population with vision disability in the United States with a correlation coefficient (R) of 0.312 and weighted average of 2.6%. Similarly, the statistical analysis conducted on geographies consisting of 156,802,362 people shows a poor positive correlation between the proportion of Immigrants from Bosnia and Herzegovina and percentage of population with vision disability in the United States with a correlation coefficient (R) of 0.126 and weighted average of 2.1%, a difference of 24.1%.
Vision Disability Correlation Summary
| Measurement | Dominican | Immigrants from Bosnia and Herzegovina |
| Minimum | 0.84% | 0.75% |
| Maximum | 8.5% | 3.7% |
| Range | 7.6% | 2.9% |
| Mean | 3.0% | 2.1% |
| Median | 2.6% | 2.1% |
| Interquartile 25% (IQ1) | 2.3% | 1.7% |
| Interquartile 75% (IQ3) | 3.6% | 2.5% |
| Interquartile Range (IQR) | 1.3% | 0.80% |
| Standard Deviation (Sample) | 1.3% | 0.64% |
| Standard Deviation (Population) | 1.3% | 0.64% |
Similar Demographics by Vision Disability
Demographics Similar to Dominicans by Vision Disability
In terms of vision disability, the demographic groups most similar to Dominicans are Blackfeet (2.6%, a difference of 0.040%), Immigrants from Yemen (2.6%, a difference of 0.37%), Arapaho (2.6%, a difference of 0.65%), Immigrants from Dominican Republic (2.6%, a difference of 0.67%), and Iroquois (2.6%, a difference of 0.70%).
| Demographics | Rating | Rank | Vision Disability |
| Aleuts | 0.0 /100 | #304 | Tragic 2.6% |
| Hispanics or Latinos | 0.0 /100 | #305 | Tragic 2.6% |
| Iroquois | 0.0 /100 | #306 | Tragic 2.6% |
| Immigrants | Dominican Republic | 0.0 /100 | #307 | Tragic 2.6% |
| Arapaho | 0.0 /100 | #308 | Tragic 2.6% |
| Immigrants | Yemen | 0.0 /100 | #309 | Tragic 2.6% |
| Blackfeet | 0.0 /100 | #310 | Tragic 2.6% |
| Dominicans | 0.0 /100 | #311 | Tragic 2.6% |
| Americans | 0.0 /100 | #312 | Tragic 2.6% |
| Potawatomi | 0.0 /100 | #313 | Tragic 2.6% |
| Inupiat | 0.0 /100 | #314 | Tragic 2.7% |
| Osage | 0.0 /100 | #315 | Tragic 2.7% |
| Shoshone | 0.0 /100 | #316 | Tragic 2.7% |
| Yup'ik | 0.0 /100 | #317 | Tragic 2.7% |
| Alaska Natives | 0.0 /100 | #318 | Tragic 2.7% |
Demographics Similar to Immigrants from Bosnia and Herzegovina by Vision Disability
In terms of vision disability, the demographic groups most similar to Immigrants from Bosnia and Herzegovina are Ukrainian (2.1%, a difference of 0.040%), South American (2.1%, a difference of 0.15%), Immigrants from Sierra Leone (2.1%, a difference of 0.15%), Italian (2.1%, a difference of 0.18%), and Sierra Leonean (2.1%, a difference of 0.30%).
| Demographics | Rating | Rank | Vision Disability |
| Arabs | 86.3 /100 | #138 | Excellent 2.1% |
| Immigrants | Morocco | 85.2 /100 | #139 | Excellent 2.1% |
| Immigrants | Netherlands | 84.2 /100 | #140 | Excellent 2.1% |
| Sierra Leoneans | 84.1 /100 | #141 | Excellent 2.1% |
| South Americans | 82.8 /100 | #142 | Excellent 2.1% |
| Immigrants | Sierra Leone | 82.8 /100 | #143 | Excellent 2.1% |
| Ukrainians | 81.9 /100 | #144 | Excellent 2.1% |
| Immigrants | Bosnia and Herzegovina | 81.5 /100 | #145 | Excellent 2.1% |
| Italians | 79.7 /100 | #146 | Good 2.1% |
| Immigrants | Sudan | 78.4 /100 | #147 | Good 2.1% |
| Finns | 78.3 /100 | #148 | Good 2.1% |
| Colombians | 76.2 /100 | #149 | Good 2.1% |
| Belgians | 75.9 /100 | #150 | Good 2.1% |
| Immigrants | Norway | 75.5 /100 | #151 | Good 2.1% |
| Immigrants | Southern Europe | 74.6 /100 | #152 | Good 2.1% |