English vs Immigrants from Bosnia and Herzegovina Vision Disability

COMPARE

English
Race
Ancestry
AfghanAfricanAlaska NativeAlaskan AthabascanAlbanianAleutAlsatianAmericanApacheArabArapahoArgentineanArmenianAssyrian/Chaldean/SyriacAustralianAustrianBahamianBangladeshiBarbadianBasqueBelgianBelizeanBermudanBhutaneseBlackfeetBolivianBrazilianBritishBritish West IndianBulgarianBurmeseCajunCambodianCanadianCape VerdeanCarpatho RusynCelticCentral AmericanCentral American IndianCherokeeCheyenneChickasawChileanChineseChippewaChoctawColombianColvilleComancheCosta RicanCreeCreekCroatianCrowCubanCypriotCzechCzechoslovakianDanishDelawareDominicanDutchDutch West IndianEastern EuropeanEcuadorianEgyptianEnglishEstonianEthiopianEuropeanFijianFilipinoFinnishFrenchFrench American IndianFrench CanadianGermanGerman RussianGhanaianGreekGuamanian/ChamorroGuatemalanGuyaneseHaitianHmongHonduranHopiHoumaHungarianIcelanderIndian (Asian)IndonesianInupiatIranianIraqiIrishIroquoisIsraeliItalianJamaicanJapaneseJordanianKenyanKiowaKoreanLaotianLatvianLebaneseLiberianLithuanianLumbeeLuxembourgerMacedonianMalaysianMalteseMarshalleseMenomineeMexicanMexican American IndianMongolianMoroccanNative HawaiianNavajoNepaleseNew ZealanderNicaraguanNigerianNorthern EuropeanNorwegianOkinawanOsageOttawaPaiutePakistaniPalestinianPanamanianParaguayanPennsylvania GermanPeruvianPimaPolishPortuguesePotawatomiPuebloPuerto RicanPuget Sound SalishRomanianRussianSalvadoranSamoanScandinavianScotch-IrishScottishSeminoleSenegaleseSerbianShoshoneSierra LeoneanSiouxSlavicSlovakSloveneSomaliSouth AfricanSouth AmericanSouth American IndianSoviet UnionSpaniardSpanishSpanish AmericanSpanish American IndianSri LankanSubsaharan AfricanSudaneseSwedishSwissSyrianTaiwaneseThaiTlingit-HaidaTohono O'OdhamTonganTrinidadian and TobagonianTsimshianTurkishU.S. Virgin IslanderUgandanUkrainianUruguayanUteVenezuelanVietnameseWelshWest IndianYakamaYaquiYugoslavianYumanYup'ikZimbabwean
Immigration
NonimmigrantsImmigrantsAfghanistanAfricaAlbaniaArgentinaArmeniaAsiaAustraliaAustriaBahamasBangladeshBarbadosBelarusBelgiumBelizeBoliviaBrazilBulgariaBurma/MyanmarCabo VerdeCambodiaCameroonCanadaCaribbeanCentral AmericaChileChinaColombiaCongoCosta RicaCroatiaCubaCzechoslovakiaDenmarkDominicaDominican RepublicEastern AfricaEastern AsiaEastern EuropeEcuadorEgyptEl SalvadorEnglandEritreaEthiopiaEuropeFijiFranceGermanyGhanaGreeceGrenadaGuatemalaGuyanaHaitiHondurasHong KongHungaryIndiaIndonesiaIranIraqIrelandIsraelItalyJamaicaJapanJordanKazakhstanKenyaKoreaKuwaitLaosLatin AmericaLatviaLebanonLiberiaLithuaniaMalaysiaMexicoMicronesiaMiddle AfricaMoldovaMoroccoNepalNetherlandsNicaraguaNigeriaNorth AmericaNorth MacedoniaNorthern AfricaNorthern EuropeNorwayOceaniaPakistanPanamaPeruPhilippinesPolandPortugalRomaniaRussiaSaudi ArabiaScotlandSenegalSerbiaSierra LeoneSingaporeSomaliaSouth AfricaSouth AmericaSouth Central AsiaSouth Eastern AsiaSouthern EuropeSpainSri LankaSt. Vincent and the GrenadinesSudanSwedenSwitzerlandSyriaTaiwanThailandTrinidad and TobagoTurkeyUgandaUkraineUruguayUzbekistanVenezuelaVietnamWest IndiesWestern AfricaWestern AsiaWestern EuropeYemenZaireZimbabweAzores
Immigrants from Bosnia and Herzegovina
Race
Ancestry
AfghanAfricanAlaska NativeAlaskan AthabascanAlbanianAleutAlsatianAmericanApacheArabArapahoArgentineanArmenianAssyrian/Chaldean/SyriacAustralianAustrianBahamianBangladeshiBarbadianBasqueBelgianBelizeanBermudanBhutaneseBlackfeetBolivianBrazilianBritishBritish West IndianBulgarianBurmeseCajunCambodianCanadianCape VerdeanCarpatho RusynCelticCentral AmericanCentral American IndianCherokeeCheyenneChickasawChileanChineseChippewaChoctawColombianColvilleComancheCosta RicanCreeCreekCroatianCrowCubanCypriotCzechCzechoslovakianDanishDelawareDominicanDutchDutch West IndianEastern EuropeanEcuadorianEgyptianEstonianEthiopianEuropeanFijianFilipinoFinnishFrenchFrench American IndianFrench CanadianGermanGerman RussianGhanaianGreekGuamanian/ChamorroGuatemalanGuyaneseHaitianHmongHonduranHopiHoumaHungarianIcelanderIndian (Asian)IndonesianInupiatIranianIraqiIrishIroquoisIsraeliItalianJamaicanJapaneseJordanianKenyanKiowaKoreanLaotianLatvianLebaneseLiberianLithuanianLumbeeLuxembourgerMacedonianMalaysianMalteseMarshalleseMenomineeMexicanMexican American IndianMongolianMoroccanNative HawaiianNavajoNepaleseNew ZealanderNicaraguanNigerianNorthern EuropeanNorwegianOkinawanOsageOttawaPaiutePakistaniPalestinianPanamanianParaguayanPennsylvania GermanPeruvianPimaPolishPortuguesePotawatomiPuebloPuerto RicanPuget Sound SalishRomanianRussianSalvadoranSamoanScandinavianScotch-IrishScottishSeminoleSenegaleseSerbianShoshoneSierra LeoneanSiouxSlavicSlovakSloveneSomaliSouth AfricanSouth AmericanSouth American IndianSoviet UnionSpaniardSpanishSpanish AmericanSpanish American IndianSri LankanSubsaharan AfricanSudaneseSwedishSwissSyrianTaiwaneseThaiTlingit-HaidaTohono O'OdhamTonganTrinidadian and TobagonianTsimshianTurkishU.S. Virgin IslanderUgandanUkrainianUruguayanUteVenezuelanVietnameseWelshWest IndianYakamaYaquiYugoslavianYumanYup'ikZimbabwean
Immigration
NonimmigrantsImmigrantsAfghanistanAfricaAlbaniaArgentinaArmeniaAsiaAustraliaAustriaBahamasBangladeshBarbadosBelarusBelgiumBelizeBoliviaBosnia and HerzegovinaBrazilBulgariaBurma/MyanmarCabo VerdeCambodiaCameroonCanadaCaribbeanCentral AmericaChileChinaColombiaCongoCosta RicaCroatiaCubaCzechoslovakiaDenmarkDominicaDominican RepublicEastern AfricaEastern AsiaEastern EuropeEcuadorEgyptEl SalvadorEnglandEritreaEthiopiaEuropeFijiFranceGermanyGhanaGreeceGrenadaGuatemalaGuyanaHaitiHondurasHong KongHungaryIndiaIndonesiaIranIraqIrelandIsraelItalyJamaicaJapanJordanKazakhstanKenyaKoreaKuwaitLaosLatin AmericaLatviaLebanonLiberiaLithuaniaMalaysiaMexicoMicronesiaMiddle AfricaMoldovaMoroccoNepalNetherlandsNicaraguaNigeriaNorth AmericaNorth MacedoniaNorthern AfricaNorthern EuropeNorwayOceaniaPakistanPanamaPeruPhilippinesPolandPortugalRomaniaRussiaSaudi ArabiaScotlandSenegalSerbiaSierra LeoneSingaporeSomaliaSouth AfricaSouth AmericaSouth Central AsiaSouth Eastern AsiaSouthern EuropeSpainSri LankaSt. Vincent and the GrenadinesSudanSwedenSwitzerlandSyriaTaiwanThailandTrinidad and TobagoTurkeyUgandaUkraineUruguayUzbekistanVenezuelaVietnamWest IndiesWestern AfricaWestern AsiaWestern EuropeYemenZaireZimbabweAzores
Vision Disability
Income
Poverty
Unemployment
Labor Participation
Family Structure
Vehicle Availability
Education Level
Disability

Vision Disability Comparison

English

Immigrants from Bosnia and Herzegovina

Tragic
Excellent
2.3%
VISION DISABILITY
1.1/ 100
METRIC RATING
239th/ 347
METRIC RANK
2.1%
VISION DISABILITY
81.5/ 100
METRIC RATING
145th/ 347
METRIC RANK

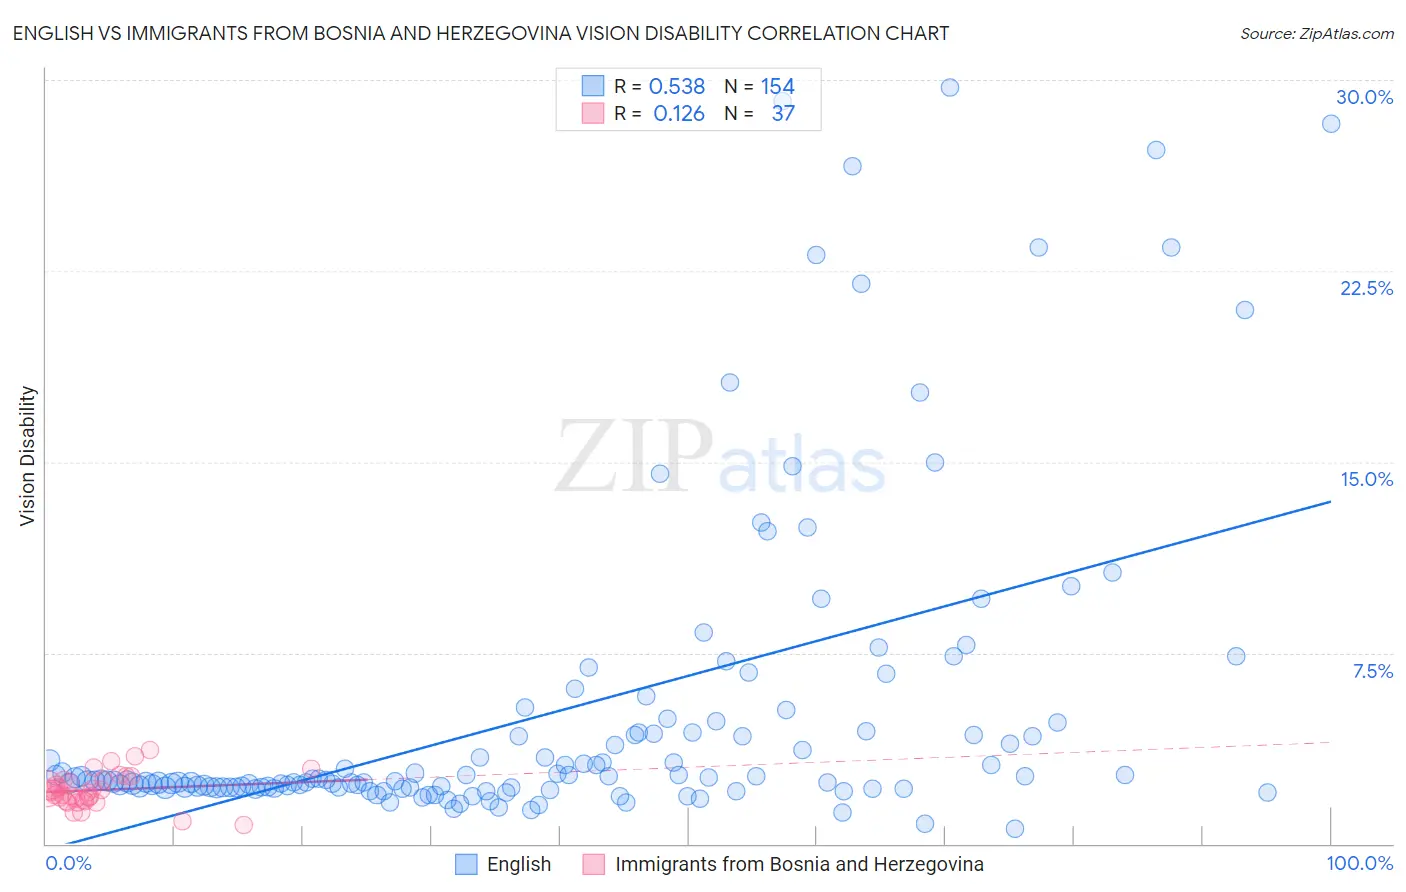
English vs Immigrants from Bosnia and Herzegovina Vision Disability Correlation Chart

The statistical analysis conducted on geographies consisting of 576,976,464 people shows a substantial positive correlation between the proportion of English and percentage of population with vision disability in the United States with a correlation coefficient (R) of 0.538 and weighted average of 2.3%. Similarly, the statistical analysis conducted on geographies consisting of 156,802,362 people shows a poor positive correlation between the proportion of Immigrants from Bosnia and Herzegovina and percentage of population with vision disability in the United States with a correlation coefficient (R) of 0.126 and weighted average of 2.1%, a difference of 9.6%.
English vs Immigrants from Bosnia and Herzegovina Vision Disability

Vision Disability Correlation Summary

MeasurementEnglishImmigrants from Bosnia and Herzegovina
Minimum0.59%0.75%
Maximum29.7%3.7%
Range29.1%2.9%
Mean5.2%2.1%
Median2.5%2.1%
Interquartile 25% (IQ1)2.2%1.7%
Interquartile 75% (IQ3)4.4%2.5%
Interquartile Range (IQR)2.2%0.80%
Standard Deviation (Sample)6.3%0.64%
Standard Deviation (Population)6.2%0.64%

Similar Demographics by Vision Disability

Demographics Similar to English by Vision Disability

In terms of vision disability, the demographic groups most similar to English are Immigrants from Cambodia (2.3%, a difference of 0.020%), Panamanian (2.3%, a difference of 0.25%), Immigrants from Portugal (2.3%, a difference of 0.29%), Malaysian (2.3%, a difference of 0.29%), and Immigrants from Congo (2.3%, a difference of 0.34%).
DemographicsRating | RankVision Disability
German Russians
1.8
/100
|
#232
Tragic
2.3%
Central Americans
1.8
/100
|
#233
Tragic
2.3%
Scottish
1.6
/100
|
#234
Tragic
2.3%
Marshallese
1.5
/100
|
#235
Tragic
2.3%
Immigrants | Congo
1.4
/100
|
#236
Tragic
2.3%
Immigrants | Portugal
1.4
/100
|
#237
Tragic
2.3%
Immigrants | Cambodia
1.1
/100
|
#238
Tragic
2.3%
English
1.1
/100
|
#239
Tragic
2.3%
Panamanians
0.9
/100
|
#240
Tragic
2.3%
Malaysians
0.9
/100
|
#241
Tragic
2.3%
Immigrants | Panama
0.8
/100
|
#242
Tragic
2.3%
Immigrants | Nicaragua
0.6
/100
|
#243
Tragic
2.3%
Immigrants | West Indies
0.6
/100
|
#244
Tragic
2.3%
Alsatians
0.6
/100
|
#245
Tragic
2.3%
French
0.5
/100
|
#246
Tragic
2.3%

Demographics Similar to Immigrants from Bosnia and Herzegovina by Vision Disability

In terms of vision disability, the demographic groups most similar to Immigrants from Bosnia and Herzegovina are Ukrainian (2.1%, a difference of 0.040%), South American (2.1%, a difference of 0.15%), Immigrants from Sierra Leone (2.1%, a difference of 0.15%), Italian (2.1%, a difference of 0.18%), and Sierra Leonean (2.1%, a difference of 0.30%).
DemographicsRating | RankVision Disability
Arabs
86.3
/100
|
#138
Excellent
2.1%
Immigrants | Morocco
85.2
/100
|
#139
Excellent
2.1%
Immigrants | Netherlands
84.2
/100
|
#140
Excellent
2.1%
Sierra Leoneans
84.1
/100
|
#141
Excellent
2.1%
South Americans
82.8
/100
|
#142
Excellent
2.1%
Immigrants | Sierra Leone
82.8
/100
|
#143
Excellent
2.1%
Ukrainians
81.9
/100
|
#144
Excellent
2.1%
Immigrants | Bosnia and Herzegovina
81.5
/100
|
#145
Excellent
2.1%
Italians
79.7
/100
|
#146
Good
2.1%
Immigrants | Sudan
78.4
/100
|
#147
Good
2.1%
Finns
78.3
/100
|
#148
Good
2.1%
Colombians
76.2
/100
|
#149
Good
2.1%
Belgians
75.9
/100
|
#150
Good
2.1%
Immigrants | Norway
75.5
/100
|
#151
Good
2.1%
Immigrants | Southern Europe
74.6
/100
|
#152
Good
2.1%