American vs Immigrants from Philippines Disability Age 65 to 74
COMPARE
American
Immigrants from Philippines
Disability Age 65 to 74
Disability Age 65 to 74 Comparison
Americans
Immigrants from Philippines
25.8%
DISABILITY AGE 65 TO 74
0.1/ 100
METRIC RATING
274th/ 347
METRIC RANK
23.2%
DISABILITY AGE 65 TO 74
61.1/ 100
METRIC RATING
163rd/ 347
METRIC RANK
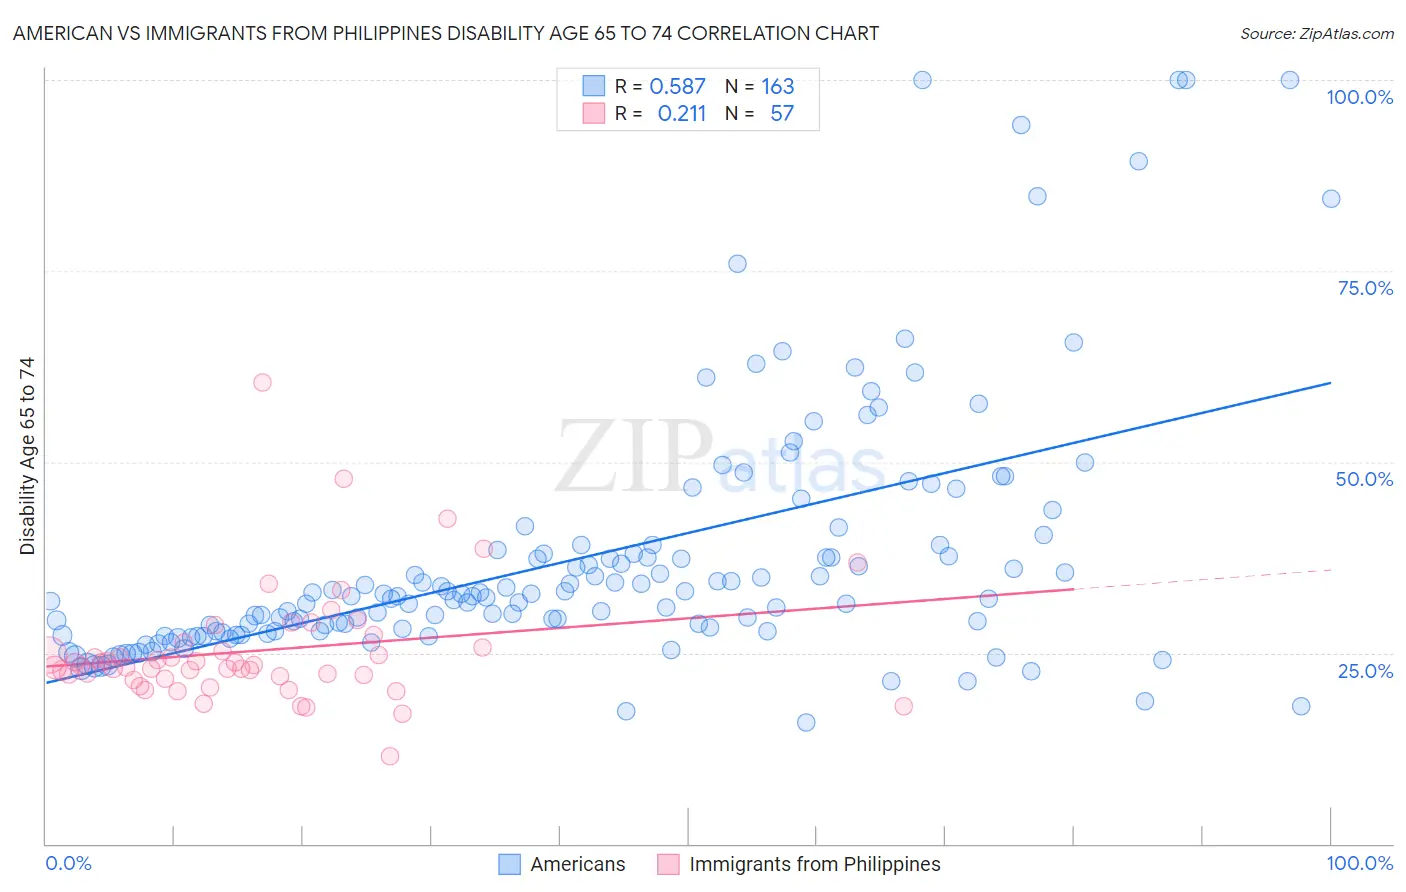
American vs Immigrants from Philippines Disability Age 65 to 74 Correlation Chart
The statistical analysis conducted on geographies consisting of 579,149,624 people shows a substantial positive correlation between the proportion of Americans and percentage of population with a disability between the ages 65 and 75 in the United States with a correlation coefficient (R) of 0.587 and weighted average of 25.8%. Similarly, the statistical analysis conducted on geographies consisting of 470,156,643 people shows a weak positive correlation between the proportion of Immigrants from Philippines and percentage of population with a disability between the ages 65 and 75 in the United States with a correlation coefficient (R) of 0.211 and weighted average of 23.2%, a difference of 11.3%.
Disability Age 65 to 74 Correlation Summary
| Measurement | American | Immigrants from Philippines |
| Minimum | 15.8% | 11.4% |
| Maximum | 100.0% | 60.5% |
| Range | 84.2% | 49.1% |
| Mean | 37.4% | 25.3% |
| Median | 32.3% | 23.3% |
| Interquartile 25% (IQ1) | 27.8% | 21.8% |
| Interquartile 75% (IQ3) | 38.4% | 26.1% |
| Interquartile Range (IQR) | 10.7% | 4.3% |
| Standard Deviation (Sample) | 16.8% | 7.7% |
| Standard Deviation (Population) | 16.7% | 7.7% |
Similar Demographics by Disability Age 65 to 74
Demographics Similar to Americans by Disability Age 65 to 74
In terms of disability age 65 to 74, the demographic groups most similar to Americans are Honduran (25.8%, a difference of 0.010%), French American Indian (25.8%, a difference of 0.020%), Belizean (25.8%, a difference of 0.11%), Immigrants from Belize (25.8%, a difference of 0.13%), and U.S. Virgin Islander (25.9%, a difference of 0.21%).
| Demographics | Rating | Rank | Disability Age 65 to 74 |
| Ottawa | 0.1 /100 | #267 | Tragic 25.6% |
| Liberians | 0.1 /100 | #268 | Tragic 25.6% |
| Hmong | 0.1 /100 | #269 | Tragic 25.7% |
| Immigrants | Guatemala | 0.1 /100 | #270 | Tragic 25.7% |
| Immigrants | Liberia | 0.1 /100 | #271 | Tragic 25.7% |
| Immigrants | Dominica | 0.1 /100 | #272 | Tragic 25.7% |
| Japanese | 0.1 /100 | #273 | Tragic 25.7% |
| Americans | 0.1 /100 | #274 | Tragic 25.8% |
| Hondurans | 0.1 /100 | #275 | Tragic 25.8% |
| French American Indians | 0.1 /100 | #276 | Tragic 25.8% |
| Belizeans | 0.1 /100 | #277 | Tragic 25.8% |
| Immigrants | Belize | 0.1 /100 | #278 | Tragic 25.8% |
| U.S. Virgin Islanders | 0.1 /100 | #279 | Tragic 25.9% |
| Cree | 0.1 /100 | #280 | Tragic 25.9% |
| Immigrants | Honduras | 0.1 /100 | #281 | Tragic 25.9% |
Demographics Similar to Immigrants from Philippines by Disability Age 65 to 74
In terms of disability age 65 to 74, the demographic groups most similar to Immigrants from Philippines are European (23.2%, a difference of 0.0%), Sierra Leonean (23.2%, a difference of 0.010%), Vietnamese (23.2%, a difference of 0.020%), Immigrants from Afghanistan (23.2%, a difference of 0.040%), and Immigrants from Cameroon (23.1%, a difference of 0.16%).
| Demographics | Rating | Rank | Disability Age 65 to 74 |
| Immigrants | Western Asia | 73.8 /100 | #156 | Good 23.0% |
| Czechoslovakians | 72.4 /100 | #157 | Good 23.0% |
| Immigrants | Vietnam | 69.1 /100 | #158 | Good 23.1% |
| South American Indians | 65.5 /100 | #159 | Good 23.1% |
| Koreans | 64.2 /100 | #160 | Good 23.1% |
| Immigrants | Cameroon | 63.8 /100 | #161 | Good 23.1% |
| Europeans | 61.2 /100 | #162 | Good 23.2% |
| Immigrants | Philippines | 61.1 /100 | #163 | Good 23.2% |
| Sierra Leoneans | 60.9 /100 | #164 | Good 23.2% |
| Vietnamese | 60.8 /100 | #165 | Good 23.2% |
| Immigrants | Afghanistan | 60.5 /100 | #166 | Good 23.2% |
| Immigrants | Bosnia and Herzegovina | 57.6 /100 | #167 | Average 23.2% |
| Pakistanis | 57.0 /100 | #168 | Average 23.2% |
| Icelanders | 54.3 /100 | #169 | Average 23.3% |
| Moroccans | 54.2 /100 | #170 | Average 23.3% |