American vs Egyptian Disability Age 65 to 74
COMPARE
American
Egyptian
Disability Age 65 to 74
Disability Age 65 to 74 Comparison
Americans
Egyptians
25.8%
DISABILITY AGE 65 TO 74
0.1/ 100
METRIC RATING
274th/ 347
METRIC RANK
21.6%
DISABILITY AGE 65 TO 74
99.5/ 100
METRIC RATING
61st/ 347
METRIC RANK
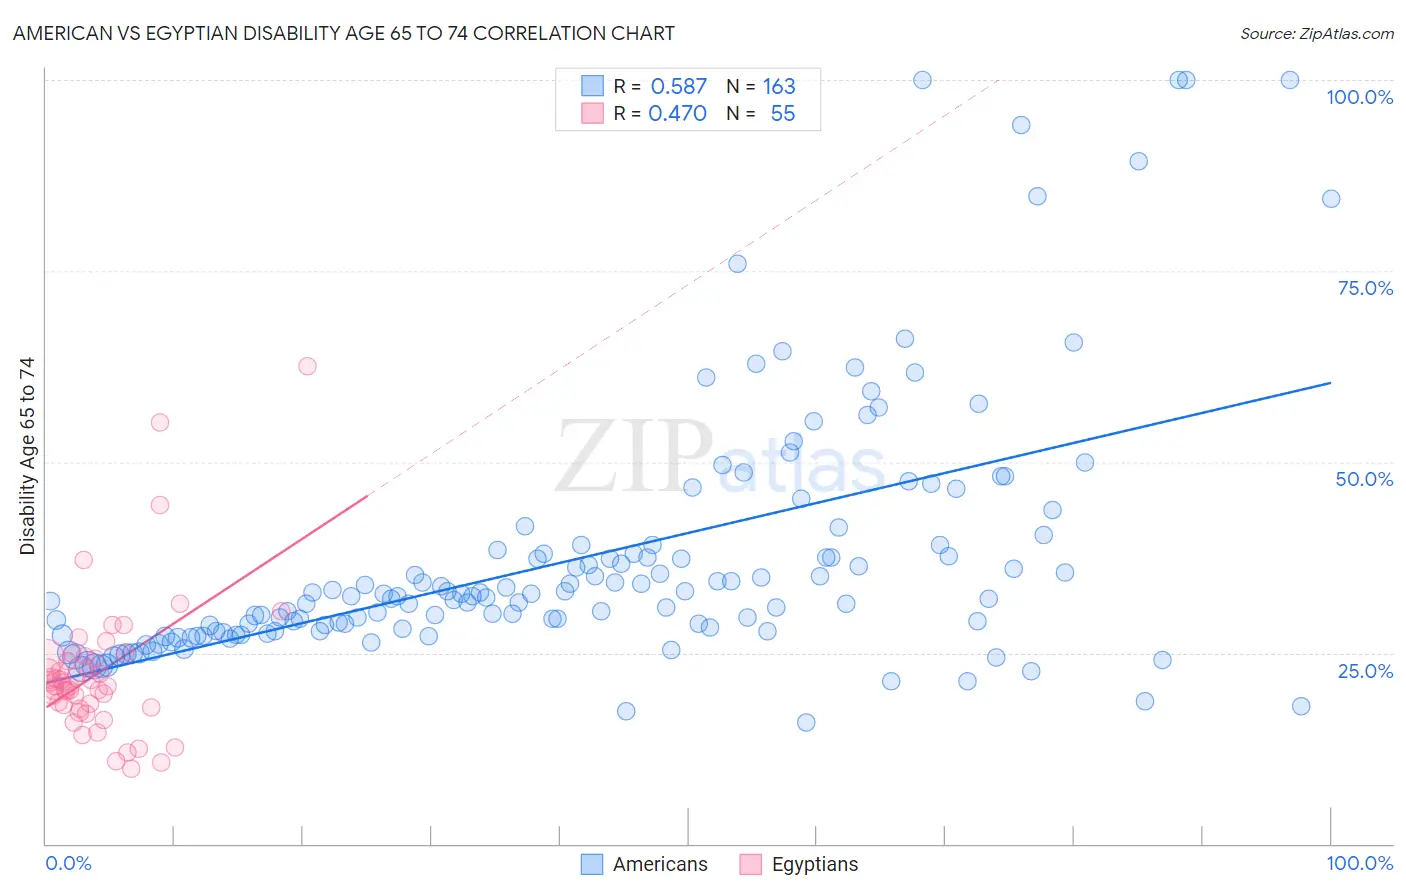
American vs Egyptian Disability Age 65 to 74 Correlation Chart
The statistical analysis conducted on geographies consisting of 579,149,624 people shows a substantial positive correlation between the proportion of Americans and percentage of population with a disability between the ages 65 and 75 in the United States with a correlation coefficient (R) of 0.587 and weighted average of 25.8%. Similarly, the statistical analysis conducted on geographies consisting of 276,538,770 people shows a moderate positive correlation between the proportion of Egyptians and percentage of population with a disability between the ages 65 and 75 in the United States with a correlation coefficient (R) of 0.470 and weighted average of 21.6%, a difference of 19.7%.
Disability Age 65 to 74 Correlation Summary
| Measurement | American | Egyptian |
| Minimum | 15.8% | 9.8% |
| Maximum | 100.0% | 62.5% |
| Range | 84.2% | 52.7% |
| Mean | 37.4% | 22.4% |
| Median | 32.3% | 20.7% |
| Interquartile 25% (IQ1) | 27.8% | 17.9% |
| Interquartile 75% (IQ3) | 38.4% | 24.4% |
| Interquartile Range (IQR) | 10.7% | 6.5% |
| Standard Deviation (Sample) | 16.8% | 9.5% |
| Standard Deviation (Population) | 16.7% | 9.4% |
Similar Demographics by Disability Age 65 to 74
Demographics Similar to Americans by Disability Age 65 to 74
In terms of disability age 65 to 74, the demographic groups most similar to Americans are Honduran (25.8%, a difference of 0.010%), French American Indian (25.8%, a difference of 0.020%), Belizean (25.8%, a difference of 0.11%), Immigrants from Belize (25.8%, a difference of 0.13%), and U.S. Virgin Islander (25.9%, a difference of 0.21%).
| Demographics | Rating | Rank | Disability Age 65 to 74 |
| Ottawa | 0.1 /100 | #267 | Tragic 25.6% |
| Liberians | 0.1 /100 | #268 | Tragic 25.6% |
| Hmong | 0.1 /100 | #269 | Tragic 25.7% |
| Immigrants | Guatemala | 0.1 /100 | #270 | Tragic 25.7% |
| Immigrants | Liberia | 0.1 /100 | #271 | Tragic 25.7% |
| Immigrants | Dominica | 0.1 /100 | #272 | Tragic 25.7% |
| Japanese | 0.1 /100 | #273 | Tragic 25.7% |
| Americans | 0.1 /100 | #274 | Tragic 25.8% |
| Hondurans | 0.1 /100 | #275 | Tragic 25.8% |
| French American Indians | 0.1 /100 | #276 | Tragic 25.8% |
| Belizeans | 0.1 /100 | #277 | Tragic 25.8% |
| Immigrants | Belize | 0.1 /100 | #278 | Tragic 25.8% |
| U.S. Virgin Islanders | 0.1 /100 | #279 | Tragic 25.9% |
| Cree | 0.1 /100 | #280 | Tragic 25.9% |
| Immigrants | Honduras | 0.1 /100 | #281 | Tragic 25.9% |
Demographics Similar to Egyptians by Disability Age 65 to 74
In terms of disability age 65 to 74, the demographic groups most similar to Egyptians are Immigrants from North Macedonia (21.6%, a difference of 0.030%), Carpatho Rusyn (21.6%, a difference of 0.030%), Zimbabwean (21.5%, a difference of 0.050%), Immigrants from Pakistan (21.5%, a difference of 0.090%), and Immigrants from Asia (21.5%, a difference of 0.12%).
| Demographics | Rating | Rank | Disability Age 65 to 74 |
| Immigrants | Italy | 99.6 /100 | #54 | Exceptional 21.5% |
| Immigrants | Romania | 99.5 /100 | #55 | Exceptional 21.5% |
| Immigrants | Denmark | 99.5 /100 | #56 | Exceptional 21.5% |
| Immigrants | Asia | 99.5 /100 | #57 | Exceptional 21.5% |
| Immigrants | Pakistan | 99.5 /100 | #58 | Exceptional 21.5% |
| Zimbabweans | 99.5 /100 | #59 | Exceptional 21.5% |
| Immigrants | North Macedonia | 99.5 /100 | #60 | Exceptional 21.6% |
| Egyptians | 99.5 /100 | #61 | Exceptional 21.6% |
| Carpatho Rusyns | 99.5 /100 | #62 | Exceptional 21.6% |
| Immigrants | Europe | 99.4 /100 | #63 | Exceptional 21.6% |
| Immigrants | Latvia | 99.4 /100 | #64 | Exceptional 21.6% |
| Immigrants | Russia | 99.4 /100 | #65 | Exceptional 21.6% |
| Maltese | 99.4 /100 | #66 | Exceptional 21.6% |
| Immigrants | South Africa | 99.3 /100 | #67 | Exceptional 21.7% |
| Immigrants | Scotland | 99.3 /100 | #68 | Exceptional 21.7% |