Aleut vs Immigrants from Ecuador Ambulatory Disability
COMPARE
Aleut
Immigrants from Ecuador
Ambulatory Disability
Ambulatory Disability Comparison
Aleuts
Immigrants from Ecuador
6.6%
AMBULATORY DISABILITY
0.4/ 100
METRIC RATING
259th/ 347
METRIC RANK
6.1%
AMBULATORY DISABILITY
53.8/ 100
METRIC RATING
170th/ 347
METRIC RANK
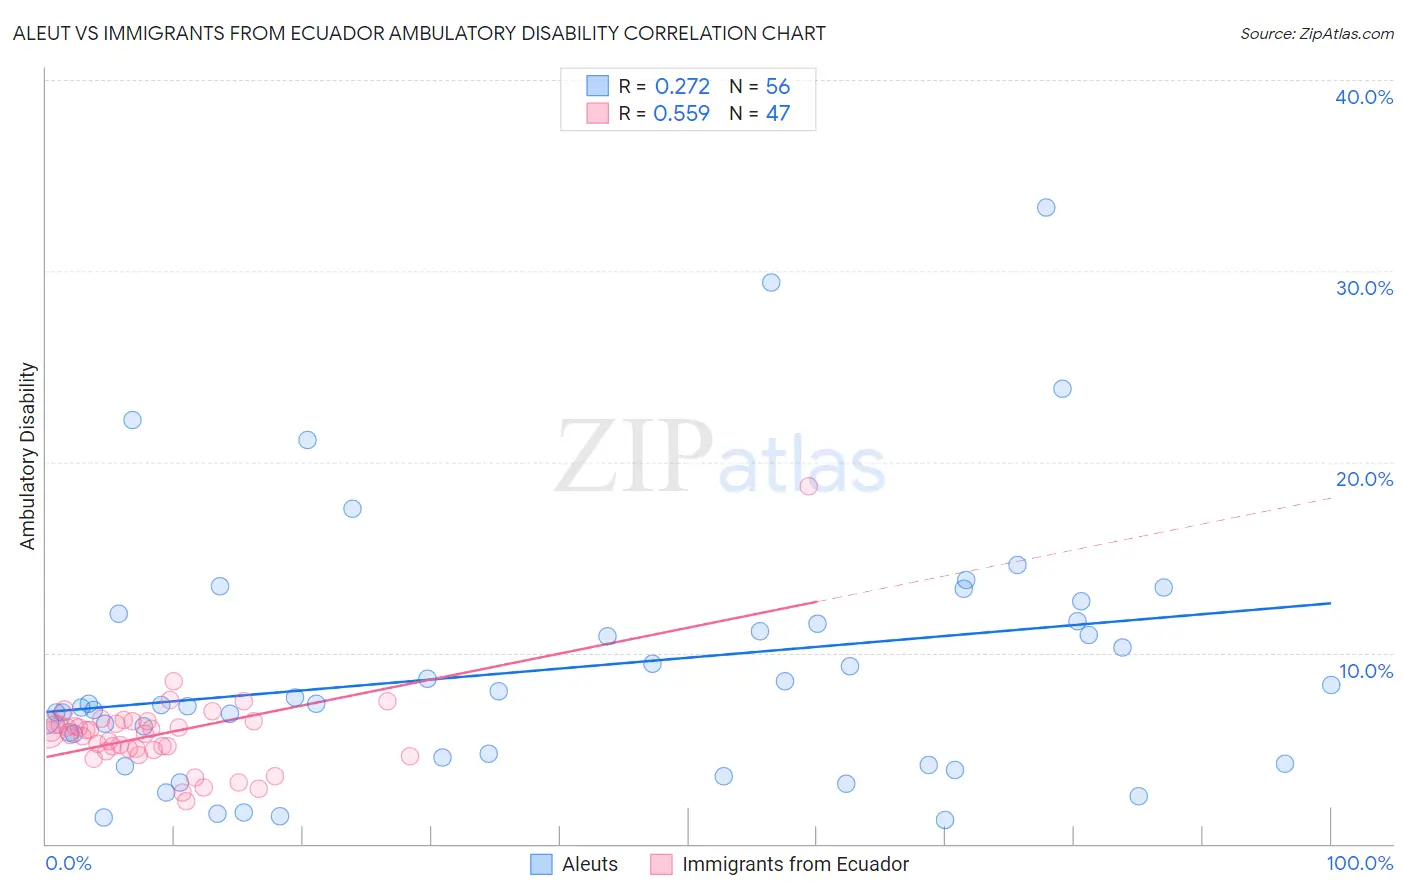
Aleut vs Immigrants from Ecuador Ambulatory Disability Correlation Chart
The statistical analysis conducted on geographies consisting of 61,775,810 people shows a weak positive correlation between the proportion of Aleuts and percentage of population with ambulatory disability in the United States with a correlation coefficient (R) of 0.272 and weighted average of 6.6%. Similarly, the statistical analysis conducted on geographies consisting of 270,935,255 people shows a substantial positive correlation between the proportion of Immigrants from Ecuador and percentage of population with ambulatory disability in the United States with a correlation coefficient (R) of 0.559 and weighted average of 6.1%, a difference of 7.4%.
Ambulatory Disability Correlation Summary
| Measurement | Aleut | Immigrants from Ecuador |
| Minimum | 1.2% | 2.2% |
| Maximum | 33.3% | 18.8% |
| Range | 32.1% | 16.5% |
| Mean | 9.1% | 5.8% |
| Median | 7.3% | 5.9% |
| Interquartile 25% (IQ1) | 4.4% | 4.9% |
| Interquartile 75% (IQ3) | 11.6% | 6.4% |
| Interquartile Range (IQR) | 7.2% | 1.5% |
| Standard Deviation (Sample) | 6.7% | 2.4% |
| Standard Deviation (Population) | 6.6% | 2.3% |
Similar Demographics by Ambulatory Disability
Demographics Similar to Aleuts by Ambulatory Disability
In terms of ambulatory disability, the demographic groups most similar to Aleuts are Immigrants from Belize (6.6%, a difference of 0.010%), Irish (6.6%, a difference of 0.080%), Spanish American Indian (6.5%, a difference of 0.18%), English (6.6%, a difference of 0.25%), and Bermudan (6.5%, a difference of 0.26%).
| Demographics | Rating | Rank | Ambulatory Disability |
| Immigrants | Bahamas | 0.8 /100 | #252 | Tragic 6.5% |
| Scottish | 0.7 /100 | #253 | Tragic 6.5% |
| Belizeans | 0.7 /100 | #254 | Tragic 6.5% |
| Welsh | 0.6 /100 | #255 | Tragic 6.5% |
| Immigrants | Uzbekistan | 0.6 /100 | #256 | Tragic 6.5% |
| Bermudans | 0.5 /100 | #257 | Tragic 6.5% |
| Spanish American Indians | 0.5 /100 | #258 | Tragic 6.5% |
| Aleuts | 0.4 /100 | #259 | Tragic 6.6% |
| Immigrants | Belize | 0.4 /100 | #260 | Tragic 6.6% |
| Irish | 0.4 /100 | #261 | Tragic 6.6% |
| English | 0.4 /100 | #262 | Tragic 6.6% |
| Hmong | 0.3 /100 | #263 | Tragic 6.6% |
| Nepalese | 0.2 /100 | #264 | Tragic 6.6% |
| Bahamians | 0.2 /100 | #265 | Tragic 6.6% |
| Guyanese | 0.2 /100 | #266 | Tragic 6.6% |
Demographics Similar to Immigrants from Ecuador by Ambulatory Disability
In terms of ambulatory disability, the demographic groups most similar to Immigrants from Ecuador are Moroccan (6.1%, a difference of 0.070%), Immigrants from Burma/Myanmar (6.1%, a difference of 0.090%), Croatian (6.1%, a difference of 0.14%), Immigrants from Canada (6.1%, a difference of 0.20%), and Immigrants from Southern Europe (6.1%, a difference of 0.23%).
| Demographics | Rating | Rank | Ambulatory Disability |
| Lebanese | 66.2 /100 | #163 | Good 6.1% |
| Basques | 63.7 /100 | #164 | Good 6.1% |
| Nicaraguans | 63.2 /100 | #165 | Good 6.1% |
| Iraqis | 62.8 /100 | #166 | Good 6.1% |
| Immigrants | Oceania | 60.7 /100 | #167 | Good 6.1% |
| Ecuadorians | 60.5 /100 | #168 | Good 6.1% |
| Immigrants | Southern Europe | 58.1 /100 | #169 | Average 6.1% |
| Immigrants | Ecuador | 53.8 /100 | #170 | Average 6.1% |
| Moroccans | 52.6 /100 | #171 | Average 6.1% |
| Immigrants | Burma/Myanmar | 52.2 /100 | #172 | Average 6.1% |
| Croatians | 51.2 /100 | #173 | Average 6.1% |
| Immigrants | Canada | 50.0 /100 | #174 | Average 6.1% |
| Vietnamese | 47.2 /100 | #175 | Average 6.1% |
| Immigrants | North America | 45.6 /100 | #176 | Average 6.1% |
| Immigrants | England | 45.4 /100 | #177 | Average 6.1% |