Nigerian vs Jordanian Male Disability
COMPARE
Nigerian
Jordanian
Male Disability
Male Disability Comparison
Nigerians
Jordanians
11.0%
MALE DISABILITY
81.9/ 100
METRIC RATING
138th/ 347
METRIC RANK
10.5%
MALE DISABILITY
99.3/ 100
METRIC RATING
64th/ 347
METRIC RANK
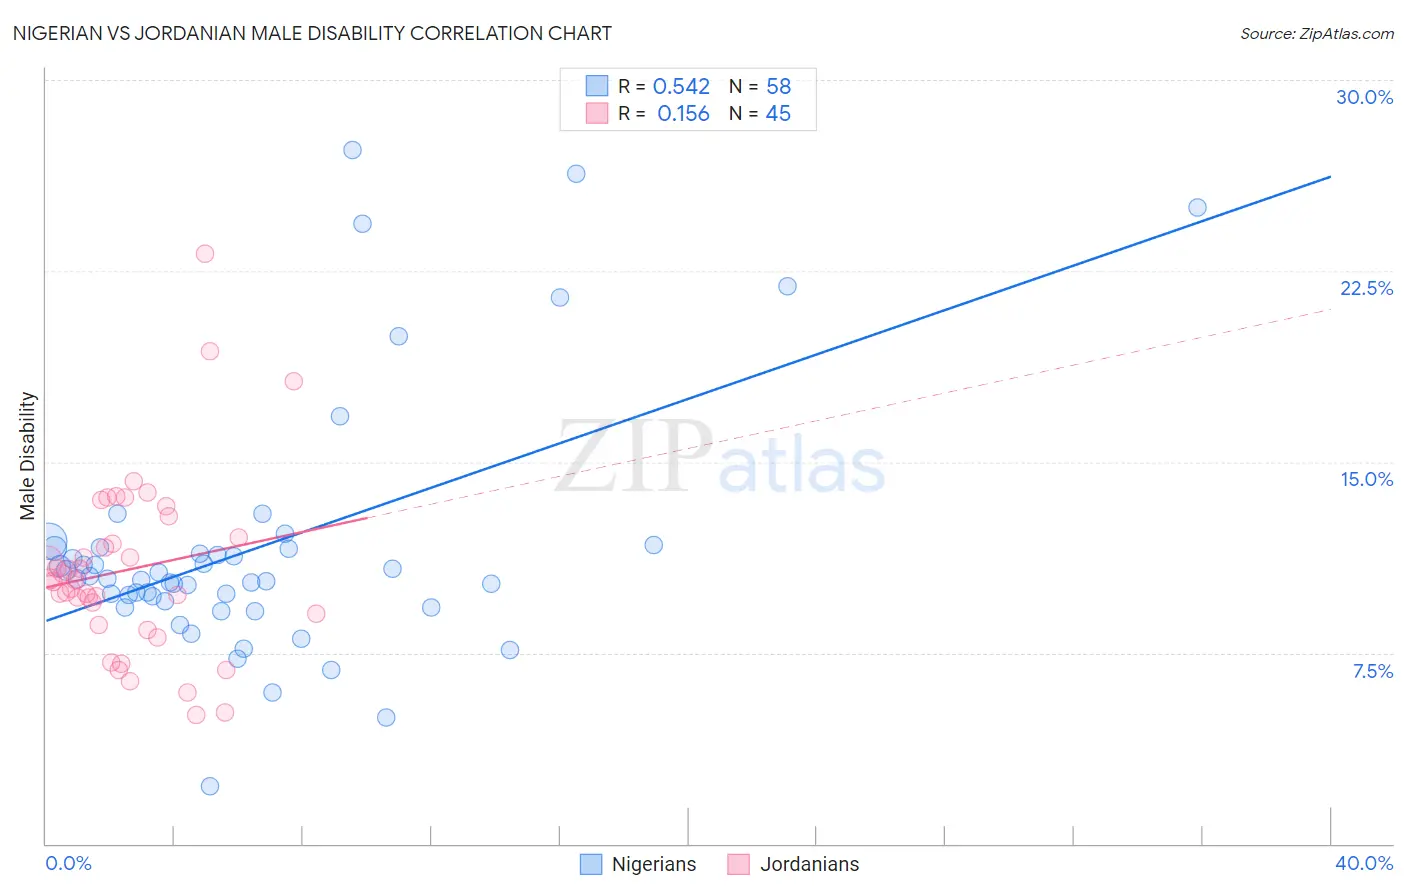
Nigerian vs Jordanian Male Disability Correlation Chart
The statistical analysis conducted on geographies consisting of 332,727,494 people shows a substantial positive correlation between the proportion of Nigerians and percentage of males with a disability in the United States with a correlation coefficient (R) of 0.542 and weighted average of 11.0%. Similarly, the statistical analysis conducted on geographies consisting of 166,415,761 people shows a poor positive correlation between the proportion of Jordanians and percentage of males with a disability in the United States with a correlation coefficient (R) of 0.156 and weighted average of 10.5%, a difference of 5.0%.
Male Disability Correlation Summary
| Measurement | Nigerian | Jordanian |
| Minimum | 2.2% | 5.0% |
| Maximum | 27.3% | 23.2% |
| Range | 25.0% | 18.1% |
| Mean | 11.7% | 10.8% |
| Median | 10.4% | 10.4% |
| Interquartile 25% (IQ1) | 9.5% | 8.8% |
| Interquartile 75% (IQ3) | 11.6% | 12.4% |
| Interquartile Range (IQR) | 2.1% | 3.6% |
| Standard Deviation (Sample) | 5.0% | 3.5% |
| Standard Deviation (Population) | 5.0% | 3.5% |
Similar Demographics by Male Disability
Demographics Similar to Nigerians by Male Disability
In terms of male disability, the demographic groups most similar to Nigerians are Immigrants from Europe (11.0%, a difference of 0.010%), South African (11.0%, a difference of 0.020%), Immigrants from Italy (11.0%, a difference of 0.030%), Arab (11.0%, a difference of 0.040%), and Immigrants from Sudan (11.0%, a difference of 0.040%).
| Demographics | Rating | Rank | Male Disability |
| Macedonians | 84.2 /100 | #131 | Excellent 11.0% |
| Immigrants | Fiji | 84.0 /100 | #132 | Excellent 11.0% |
| Ugandans | 83.9 /100 | #133 | Excellent 11.0% |
| Bhutanese | 83.4 /100 | #134 | Excellent 11.0% |
| Trinidadians and Tobagonians | 83.3 /100 | #135 | Excellent 11.0% |
| Immigrants | Costa Rica | 82.8 /100 | #136 | Excellent 11.0% |
| Immigrants | Europe | 82.0 /100 | #137 | Excellent 11.0% |
| Nigerians | 81.9 /100 | #138 | Excellent 11.0% |
| South Africans | 81.7 /100 | #139 | Excellent 11.0% |
| Immigrants | Italy | 81.5 /100 | #140 | Excellent 11.0% |
| Arabs | 81.5 /100 | #141 | Excellent 11.0% |
| Immigrants | Sudan | 81.5 /100 | #142 | Excellent 11.0% |
| Moroccans | 80.7 /100 | #143 | Excellent 11.0% |
| Kenyans | 78.1 /100 | #144 | Good 11.0% |
| Costa Ricans | 78.0 /100 | #145 | Good 11.0% |
Demographics Similar to Jordanians by Male Disability
In terms of male disability, the demographic groups most similar to Jordanians are Immigrants from Grenada (10.5%, a difference of 0.020%), Guyanese (10.5%, a difference of 0.030%), Immigrants from Afghanistan (10.5%, a difference of 0.030%), Immigrants from Belarus (10.4%, a difference of 0.12%), and Colombian (10.5%, a difference of 0.13%).
| Demographics | Rating | Rank | Male Disability |
| Immigrants | South America | 99.6 /100 | #57 | Exceptional 10.4% |
| Immigrants | Japan | 99.5 /100 | #58 | Exceptional 10.4% |
| Immigrants | Australia | 99.5 /100 | #59 | Exceptional 10.4% |
| Immigrants | Colombia | 99.5 /100 | #60 | Exceptional 10.4% |
| Immigrants | Northern Africa | 99.4 /100 | #61 | Exceptional 10.4% |
| Immigrants | Ecuador | 99.3 /100 | #62 | Exceptional 10.4% |
| Immigrants | Belarus | 99.3 /100 | #63 | Exceptional 10.4% |
| Jordanians | 99.3 /100 | #64 | Exceptional 10.5% |
| Immigrants | Grenada | 99.2 /100 | #65 | Exceptional 10.5% |
| Guyanese | 99.2 /100 | #66 | Exceptional 10.5% |
| Immigrants | Afghanistan | 99.2 /100 | #67 | Exceptional 10.5% |
| Colombians | 99.2 /100 | #68 | Exceptional 10.5% |
| Ecuadorians | 99.2 /100 | #69 | Exceptional 10.5% |
| Immigrants | Bulgaria | 99.1 /100 | #70 | Exceptional 10.5% |
| Immigrants | Cameroon | 99.0 /100 | #71 | Exceptional 10.5% |