Aleut vs Jordanian Average Family Size
COMPARE
Aleut
Jordanian
Average Family Size
Average Family Size Comparison
Aleuts
Jordanians
3.23
AVERAGE FAMILY SIZE
54.1/ 100
METRIC RATING
169th/ 347
METRIC RANK
3.24
AVERAGE FAMILY SIZE
73.5/ 100
METRIC RATING
151st/ 347
METRIC RANK
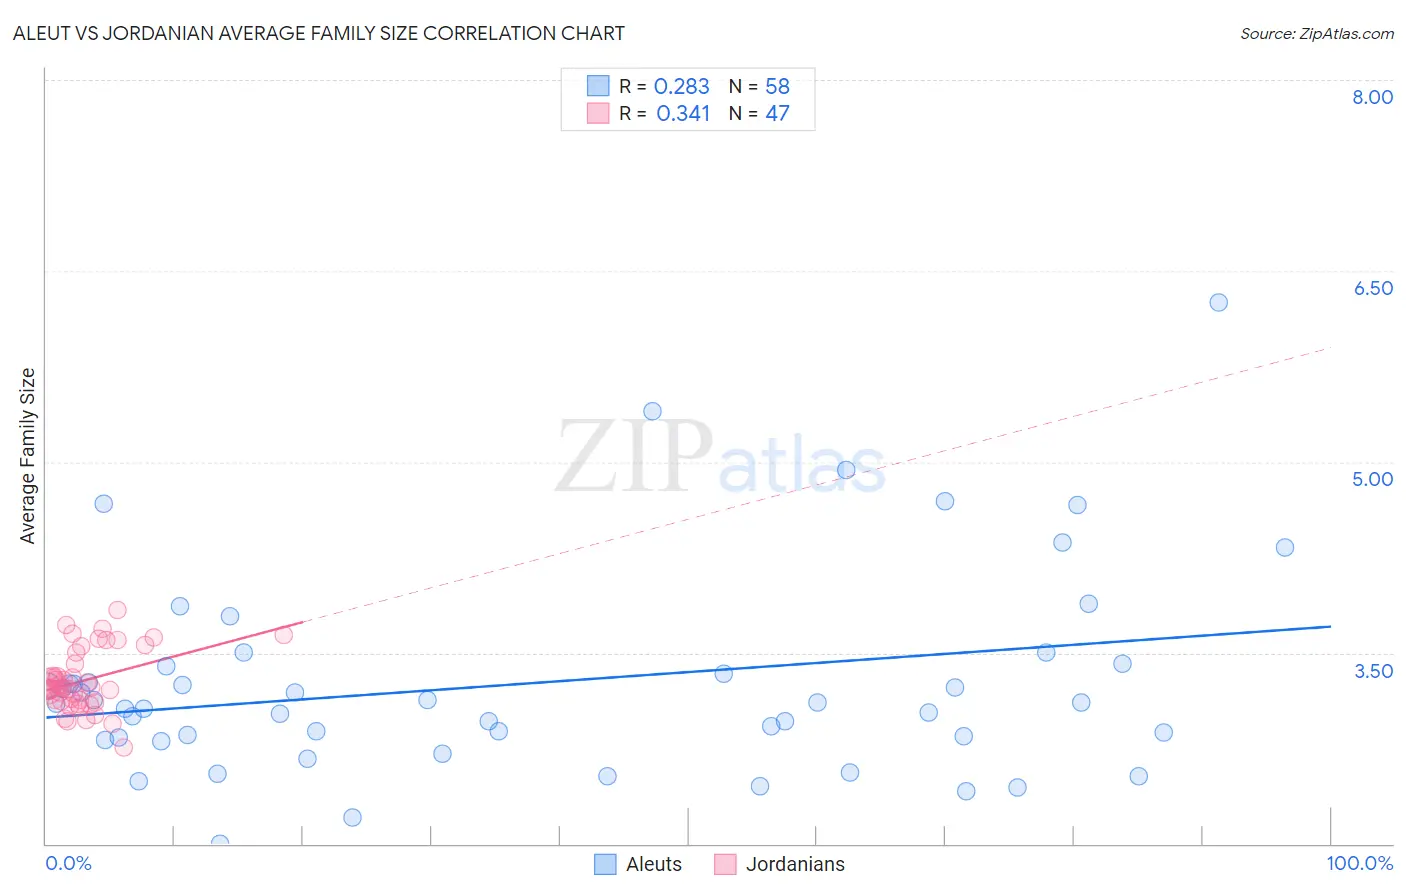
Aleut vs Jordanian Average Family Size Correlation Chart
The statistical analysis conducted on geographies consisting of 61,774,042 people shows a weak positive correlation between the proportion of Aleuts and average family size in the United States with a correlation coefficient (R) of 0.283 and weighted average of 3.23. Similarly, the statistical analysis conducted on geographies consisting of 166,395,405 people shows a mild positive correlation between the proportion of Jordanians and average family size in the United States with a correlation coefficient (R) of 0.341 and weighted average of 3.24, a difference of 0.39%.
Average Family Size Correlation Summary
| Measurement | Aleut | Jordanian |
| Minimum | 2.00 | 2.76 |
| Maximum | 6.25 | 3.84 |
| Range | 4.25 | 1.08 |
| Mean | 3.26 | 3.28 |
| Median | 3.11 | 3.22 |
| Interquartile 25% (IQ1) | 2.84 | 3.12 |
| Interquartile 75% (IQ3) | 3.39 | 3.50 |
| Interquartile Range (IQR) | 0.55 | 0.38 |
| Standard Deviation (Sample) | 0.80 | 0.24 |
| Standard Deviation (Population) | 0.79 | 0.24 |
Demographics Similar to Aleuts and Jordanians by Average Family Size
In terms of average family size, the demographic groups most similar to Aleuts are Taiwanese (3.23, a difference of 0.0%), Arab (3.23, a difference of 0.010%), Dutch West Indian (3.23, a difference of 0.050%), Immigrants from Senegal (3.23, a difference of 0.060%), and Egyptian (3.23, a difference of 0.080%). Similarly, the demographic groups most similar to Jordanians are Indian (Asian) (3.24, a difference of 0.0%), Spanish American (3.24, a difference of 0.020%), Immigrants from Eritrea (3.24, a difference of 0.050%), Immigrants from Egypt (3.24, a difference of 0.080%), and Seminole (3.24, a difference of 0.12%).
| Demographics | Rating | Rank | Average Family Size |
| Indians (Asian) | 73.6 /100 | #150 | Good 3.24 |
| Jordanians | 73.5 /100 | #151 | Good 3.24 |
| Spanish Americans | 72.5 /100 | #152 | Good 3.24 |
| Immigrants | Eritrea | 71.4 /100 | #153 | Good 3.24 |
| Immigrants | Egypt | 70.0 /100 | #154 | Good 3.24 |
| Seminole | 68.2 /100 | #155 | Good 3.24 |
| Immigrants | Taiwan | 68.1 /100 | #156 | Good 3.24 |
| Immigrants | Uzbekistan | 67.0 /100 | #157 | Good 3.24 |
| Iraqis | 64.3 /100 | #158 | Good 3.24 |
| Ethiopians | 63.9 /100 | #159 | Good 3.24 |
| Immigrants | Iraq | 63.7 /100 | #160 | Good 3.24 |
| Immigrants | Chile | 63.2 /100 | #161 | Good 3.24 |
| Immigrants | Uganda | 60.1 /100 | #162 | Good 3.23 |
| Uruguayans | 58.8 /100 | #163 | Average 3.23 |
| Egyptians | 58.6 /100 | #164 | Average 3.23 |
| Ugandans | 58.4 /100 | #165 | Average 3.23 |
| Immigrants | Senegal | 57.5 /100 | #166 | Average 3.23 |
| Dutch West Indians | 56.9 /100 | #167 | Average 3.23 |
| Taiwanese | 54.2 /100 | #168 | Average 3.23 |
| Aleuts | 54.1 /100 | #169 | Average 3.23 |
| Arabs | 53.8 /100 | #170 | Average 3.23 |