Aleut vs Immigrants from Afghanistan Professional Degree
COMPARE
Aleut
Immigrants from Afghanistan
Professional Degree
Professional Degree Comparison
Aleuts
Immigrants from Afghanistan
3.6%
PROFESSIONAL DEGREE
0.7/ 100
METRIC RATING
268th/ 347
METRIC RANK
4.5%
PROFESSIONAL DEGREE
59.2/ 100
METRIC RATING
167th/ 347
METRIC RANK
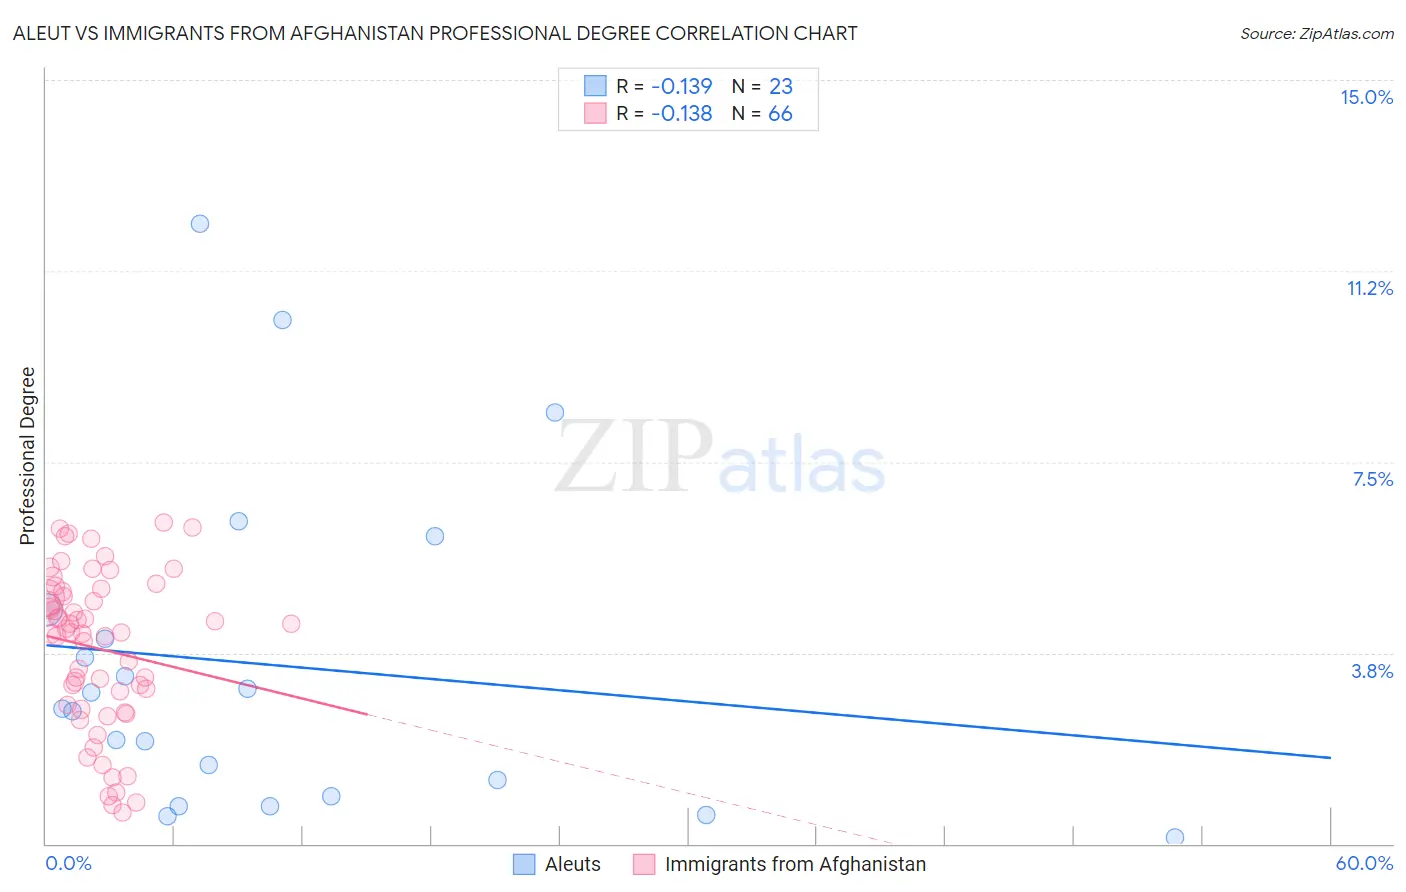
Aleut vs Immigrants from Afghanistan Professional Degree Correlation Chart
The statistical analysis conducted on geographies consisting of 61,685,490 people shows a poor negative correlation between the proportion of Aleuts and percentage of population with at least professional degree education in the United States with a correlation coefficient (R) of -0.139 and weighted average of 3.6%. Similarly, the statistical analysis conducted on geographies consisting of 147,614,795 people shows a poor negative correlation between the proportion of Immigrants from Afghanistan and percentage of population with at least professional degree education in the United States with a correlation coefficient (R) of -0.138 and weighted average of 4.5%, a difference of 23.5%.
Professional Degree Correlation Summary
| Measurement | Aleut | Immigrants from Afghanistan |
| Minimum | 0.13% | 0.62% |
| Maximum | 12.2% | 6.3% |
| Range | 12.1% | 5.7% |
| Mean | 3.5% | 3.8% |
| Median | 2.6% | 4.1% |
| Interquartile 25% (IQ1) | 0.93% | 2.7% |
| Interquartile 75% (IQ3) | 4.6% | 5.0% |
| Interquartile Range (IQR) | 3.7% | 2.2% |
| Standard Deviation (Sample) | 3.2% | 1.5% |
| Standard Deviation (Population) | 3.1% | 1.5% |
Similar Demographics by Professional Degree
Demographics Similar to Aleuts by Professional Degree
In terms of professional degree, the demographic groups most similar to Aleuts are Delaware (3.6%, a difference of 0.15%), Central American Indian (3.6%, a difference of 0.42%), Immigrants from Cuba (3.6%, a difference of 0.60%), Immigrants from Congo (3.6%, a difference of 0.74%), and Immigrants from Cambodia (3.6%, a difference of 0.78%).
| Demographics | Rating | Rank | Professional Degree |
| Immigrants | Guyana | 1.0 /100 | #261 | Tragic 3.7% |
| U.S. Virgin Islanders | 1.0 /100 | #262 | Tragic 3.7% |
| Hopi | 0.9 /100 | #263 | Tragic 3.6% |
| Immigrants | Cambodia | 0.9 /100 | #264 | Tragic 3.6% |
| Immigrants | Congo | 0.8 /100 | #265 | Tragic 3.6% |
| Central American Indians | 0.8 /100 | #266 | Tragic 3.6% |
| Delaware | 0.7 /100 | #267 | Tragic 3.6% |
| Aleuts | 0.7 /100 | #268 | Tragic 3.6% |
| Immigrants | Cuba | 0.6 /100 | #269 | Tragic 3.6% |
| Central Americans | 0.6 /100 | #270 | Tragic 3.6% |
| Belizeans | 0.5 /100 | #271 | Tragic 3.6% |
| Immigrants | Jamaica | 0.5 /100 | #272 | Tragic 3.6% |
| Americans | 0.5 /100 | #273 | Tragic 3.6% |
| Potawatomi | 0.5 /100 | #274 | Tragic 3.6% |
| Immigrants | Dominica | 0.5 /100 | #275 | Tragic 3.6% |
Demographics Similar to Immigrants from Afghanistan by Professional Degree
In terms of professional degree, the demographic groups most similar to Immigrants from Afghanistan are Immigrants from Colombia (4.5%, a difference of 0.030%), Immigrants from Sierra Leone (4.5%, a difference of 0.070%), Chinese (4.5%, a difference of 0.080%), Costa Rican (4.5%, a difference of 0.11%), and Immigrants from Zaire (4.5%, a difference of 0.26%).
| Demographics | Rating | Rank | Professional Degree |
| Immigrants | Senegal | 68.0 /100 | #160 | Good 4.5% |
| Assyrians/Chaldeans/Syriacs | 67.4 /100 | #161 | Good 4.5% |
| Peruvians | 65.2 /100 | #162 | Good 4.5% |
| Sierra Leoneans | 64.3 /100 | #163 | Good 4.5% |
| Swiss | 61.0 /100 | #164 | Good 4.5% |
| Costa Ricans | 59.9 /100 | #165 | Average 4.5% |
| Immigrants | Colombia | 59.4 /100 | #166 | Average 4.5% |
| Immigrants | Afghanistan | 59.2 /100 | #167 | Average 4.5% |
| Immigrants | Sierra Leone | 58.7 /100 | #168 | Average 4.5% |
| Chinese | 58.6 /100 | #169 | Average 4.5% |
| Immigrants | Zaire | 57.4 /100 | #170 | Average 4.5% |
| Immigrants | Bangladesh | 56.0 /100 | #171 | Average 4.4% |
| Spaniards | 52.0 /100 | #172 | Average 4.4% |
| English | 50.1 /100 | #173 | Average 4.4% |
| Kenyans | 50.0 /100 | #174 | Average 4.4% |