Alaska Native vs Immigrants from Afghanistan Cognitive Disability
COMPARE
Alaska Native
Immigrants from Afghanistan
Cognitive Disability
Cognitive Disability Comparison
Alaska Natives
Immigrants from Afghanistan
17.5%
COGNITIVE DISABILITY
10.4/ 100
METRIC RATING
206th/ 347
METRIC RANK
17.5%
COGNITIVE DISABILITY
16.7/ 100
METRIC RATING
197th/ 347
METRIC RANK
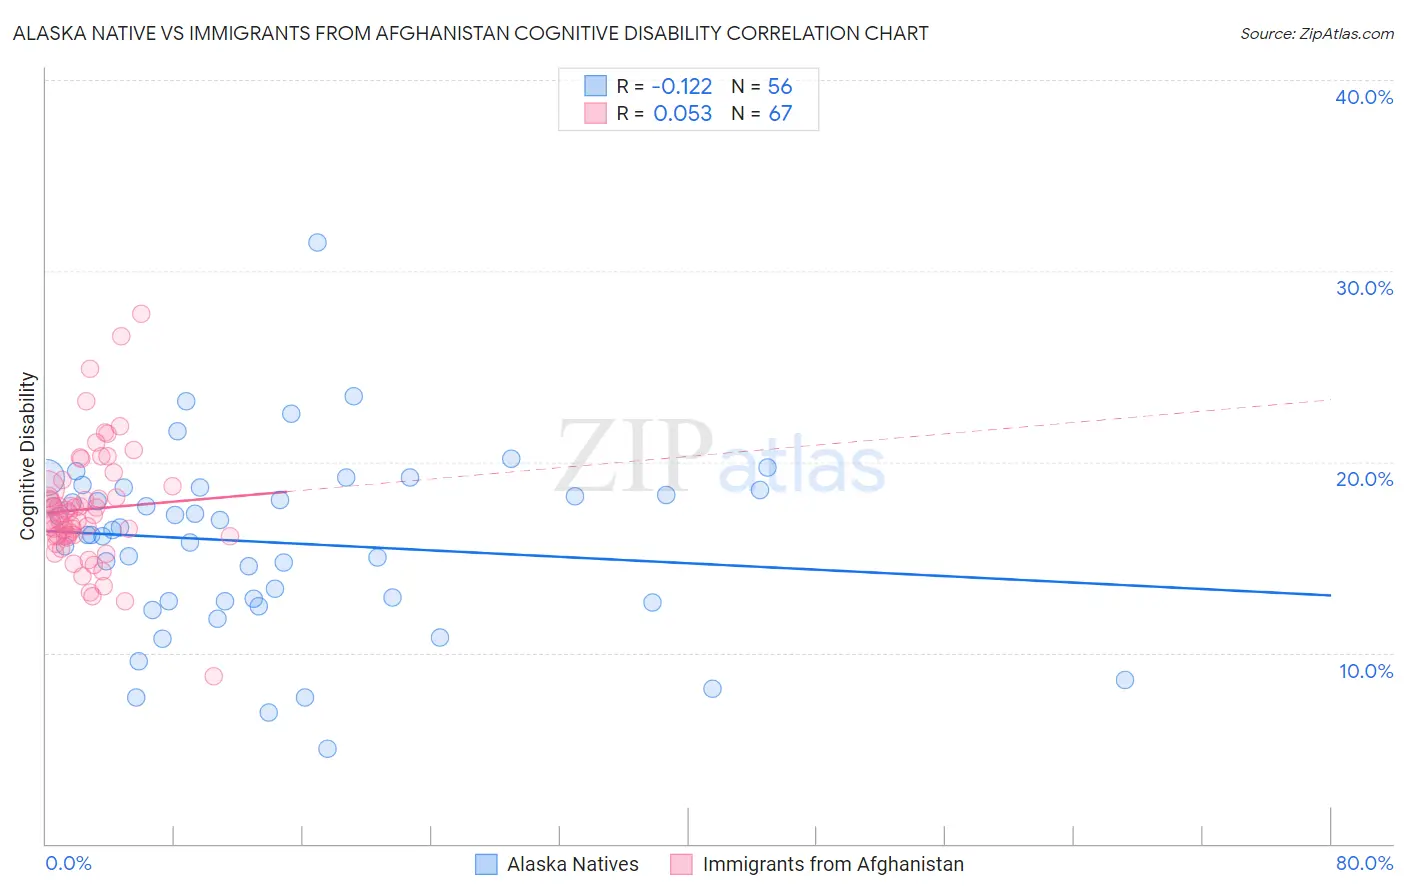
Alaska Native vs Immigrants from Afghanistan Cognitive Disability Correlation Chart
The statistical analysis conducted on geographies consisting of 76,778,470 people shows a poor negative correlation between the proportion of Alaska Natives and percentage of population with cognitive disability in the United States with a correlation coefficient (R) of -0.122 and weighted average of 17.5%. Similarly, the statistical analysis conducted on geographies consisting of 147,641,735 people shows a slight positive correlation between the proportion of Immigrants from Afghanistan and percentage of population with cognitive disability in the United States with a correlation coefficient (R) of 0.053 and weighted average of 17.5%, a difference of 0.39%.
Cognitive Disability Correlation Summary
| Measurement | Alaska Native | Immigrants from Afghanistan |
| Minimum | 5.0% | 8.8% |
| Maximum | 31.5% | 27.8% |
| Range | 26.5% | 19.0% |
| Mean | 15.8% | 17.5% |
| Median | 16.3% | 16.9% |
| Interquartile 25% (IQ1) | 12.7% | 16.1% |
| Interquartile 75% (IQ3) | 18.6% | 18.6% |
| Interquartile Range (IQR) | 5.9% | 2.5% |
| Standard Deviation (Sample) | 4.7% | 3.1% |
| Standard Deviation (Population) | 4.7% | 3.1% |
Demographics Similar to Alaska Natives and Immigrants from Afghanistan by Cognitive Disability
In terms of cognitive disability, the demographic groups most similar to Alaska Natives are Immigrants from Zimbabwe (17.5%, a difference of 0.040%), Puget Sound Salish (17.5%, a difference of 0.040%), Immigrants from Caribbean (17.5%, a difference of 0.050%), Immigrants from Latin America (17.6%, a difference of 0.050%), and Immigrants from Cameroon (17.6%, a difference of 0.090%). Similarly, the demographic groups most similar to Immigrants from Afghanistan are Guyanese (17.5%, a difference of 0.040%), Immigrants from Panama (17.5%, a difference of 0.10%), Immigrants from Singapore (17.5%, a difference of 0.13%), Haitian (17.5%, a difference of 0.14%), and New Zealander (17.4%, a difference of 0.20%).
| Demographics | Rating | Rank | Cognitive Disability |
| Immigrants | Nonimmigrants | 27.4 /100 | #191 | Fair 17.4% |
| Immigrants | Haiti | 27.1 /100 | #192 | Fair 17.4% |
| Delaware | 25.6 /100 | #193 | Fair 17.4% |
| Immigrants | Bosnia and Herzegovina | 22.0 /100 | #194 | Fair 17.4% |
| New Zealanders | 21.1 /100 | #195 | Fair 17.4% |
| Guyanese | 17.5 /100 | #196 | Poor 17.5% |
| Immigrants | Afghanistan | 16.7 /100 | #197 | Poor 17.5% |
| Immigrants | Panama | 14.8 /100 | #198 | Poor 17.5% |
| Immigrants | Singapore | 14.3 /100 | #199 | Poor 17.5% |
| Haitians | 14.1 /100 | #200 | Poor 17.5% |
| South American Indians | 13.0 /100 | #201 | Poor 17.5% |
| Immigrants | Morocco | 12.0 /100 | #202 | Poor 17.5% |
| Immigrants | Caribbean | 11.0 /100 | #203 | Poor 17.5% |
| Immigrants | Zimbabwe | 11.0 /100 | #204 | Poor 17.5% |
| Puget Sound Salish | 10.9 /100 | #205 | Poor 17.5% |
| Alaska Natives | 10.4 /100 | #206 | Poor 17.5% |
| Immigrants | Latin America | 9.7 /100 | #207 | Tragic 17.6% |
| Immigrants | Cameroon | 9.3 /100 | #208 | Tragic 17.6% |
| Immigrants | Trinidad and Tobago | 8.7 /100 | #209 | Tragic 17.6% |
| Immigrants | Jamaica | 8.5 /100 | #210 | Tragic 17.6% |
| Taiwanese | 7.7 /100 | #211 | Tragic 17.6% |