Venezuelan vs Immigrants from Russia Hearing Disability
COMPARE
Venezuelan
Immigrants from Russia
Hearing Disability
Hearing Disability Comparison
Venezuelans
Immigrants from Russia
2.6%
HEARING DISABILITY
99.4/ 100
METRIC RATING
45th/ 347
METRIC RANK
2.9%
HEARING DISABILITY
77.7/ 100
METRIC RATING
148th/ 347
METRIC RANK
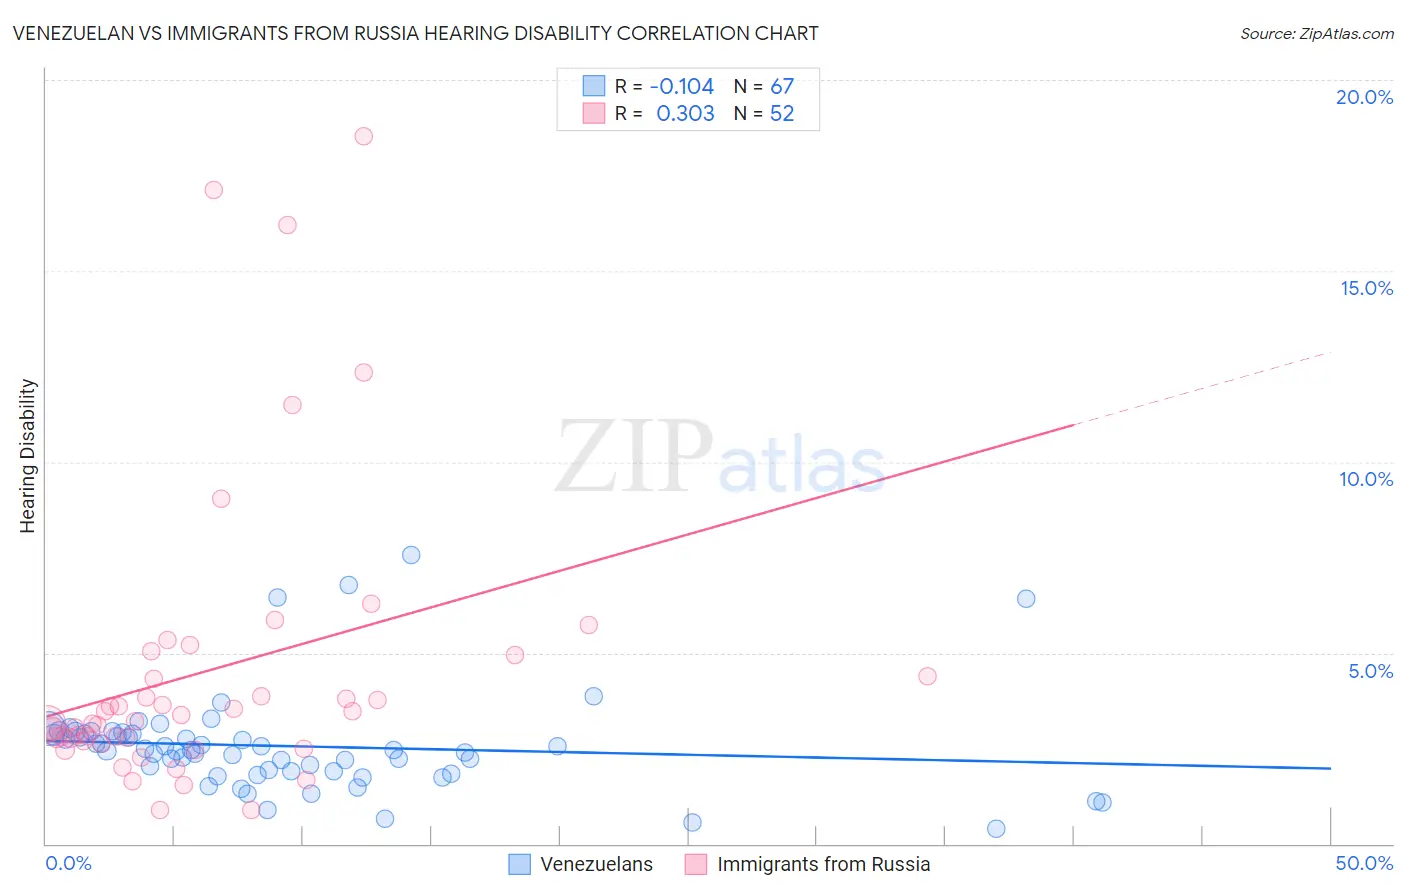
Venezuelan vs Immigrants from Russia Hearing Disability Correlation Chart
The statistical analysis conducted on geographies consisting of 306,240,501 people shows a poor negative correlation between the proportion of Venezuelans and percentage of population with hearing disability in the United States with a correlation coefficient (R) of -0.104 and weighted average of 2.6%. Similarly, the statistical analysis conducted on geographies consisting of 347,834,739 people shows a mild positive correlation between the proportion of Immigrants from Russia and percentage of population with hearing disability in the United States with a correlation coefficient (R) of 0.303 and weighted average of 2.9%, a difference of 10.1%.
Hearing Disability Correlation Summary
| Measurement | Venezuelan | Immigrants from Russia |
| Minimum | 0.40% | 0.87% |
| Maximum | 7.6% | 18.5% |
| Range | 7.2% | 17.7% |
| Mean | 2.6% | 4.5% |
| Median | 2.4% | 3.3% |
| Interquartile 25% (IQ1) | 1.9% | 2.7% |
| Interquartile 75% (IQ3) | 2.9% | 4.7% |
| Interquartile Range (IQR) | 0.97% | 1.9% |
| Standard Deviation (Sample) | 1.3% | 3.9% |
| Standard Deviation (Population) | 1.3% | 3.8% |
Similar Demographics by Hearing Disability
Demographics Similar to Venezuelans by Hearing Disability
In terms of hearing disability, the demographic groups most similar to Venezuelans are Nigerian (2.6%, a difference of 0.020%), Immigrants from Dominica (2.6%, a difference of 0.10%), West Indian (2.6%, a difference of 0.25%), Senegalese (2.6%, a difference of 0.25%), and Immigrants from Israel (2.6%, a difference of 0.25%).
| Demographics | Rating | Rank | Hearing Disability |
| Immigrants | Jamaica | 99.5 /100 | #38 | Exceptional 2.6% |
| Immigrants | China | 99.5 /100 | #39 | Exceptional 2.6% |
| Haitians | 99.5 /100 | #40 | Exceptional 2.6% |
| Immigrants | Taiwan | 99.4 /100 | #41 | Exceptional 2.6% |
| West Indians | 99.4 /100 | #42 | Exceptional 2.6% |
| Senegalese | 99.4 /100 | #43 | Exceptional 2.6% |
| Nigerians | 99.4 /100 | #44 | Exceptional 2.6% |
| Venezuelans | 99.4 /100 | #45 | Exceptional 2.6% |
| Immigrants | Dominica | 99.3 /100 | #46 | Exceptional 2.6% |
| Immigrants | Israel | 99.3 /100 | #47 | Exceptional 2.6% |
| Immigrants | Singapore | 99.3 /100 | #48 | Exceptional 2.6% |
| Immigrants | South America | 99.2 /100 | #49 | Exceptional 2.7% |
| Paraguayans | 99.2 /100 | #50 | Exceptional 2.7% |
| Immigrants | Hong Kong | 99.2 /100 | #51 | Exceptional 2.7% |
| Jamaicans | 99.0 /100 | #52 | Exceptional 2.7% |
Demographics Similar to Immigrants from Russia by Hearing Disability
In terms of hearing disability, the demographic groups most similar to Immigrants from Russia are Immigrants from Panama (2.9%, a difference of 0.11%), Tongan (2.9%, a difference of 0.13%), Brazilian (2.9%, a difference of 0.15%), Immigrants from Congo (2.9%, a difference of 0.17%), and Immigrants from Bulgaria (2.9%, a difference of 0.21%).
| Demographics | Rating | Rank | Hearing Disability |
| Sub-Saharan Africans | 83.3 /100 | #141 | Excellent 2.9% |
| Laotians | 81.1 /100 | #142 | Excellent 2.9% |
| Immigrants | Bahamas | 80.9 /100 | #143 | Excellent 2.9% |
| Immigrants | Bulgaria | 79.2 /100 | #144 | Good 2.9% |
| Immigrants | Congo | 78.9 /100 | #145 | Good 2.9% |
| Brazilians | 78.7 /100 | #146 | Good 2.9% |
| Tongans | 78.6 /100 | #147 | Good 2.9% |
| Immigrants | Russia | 77.7 /100 | #148 | Good 2.9% |
| Immigrants | Panama | 76.9 /100 | #149 | Good 2.9% |
| Palestinians | 73.6 /100 | #150 | Good 2.9% |
| Immigrants | France | 73.1 /100 | #151 | Good 2.9% |
| Immigrants | Lithuania | 73.0 /100 | #152 | Good 2.9% |
| Sudanese | 72.1 /100 | #153 | Good 2.9% |
| Immigrants | Lebanon | 71.5 /100 | #154 | Good 2.9% |
| Costa Ricans | 71.4 /100 | #155 | Good 2.9% |