Alaskan Athabascan vs Paiute Disability Age Under 5
COMPARE
Alaskan Athabascan
Paiute
Disability Age Under 5
Disability Age Under 5 Comparison
Alaskan Athabascans
Paiute
1.5%
DISABILITY AGE UNDER 5
0.1/ 100
METRIC RATING
273rd/ 347
METRIC RANK
3.9%
DISABILITY AGE UNDER 5
0.0/ 100
METRIC RATING
345th/ 347
METRIC RANK
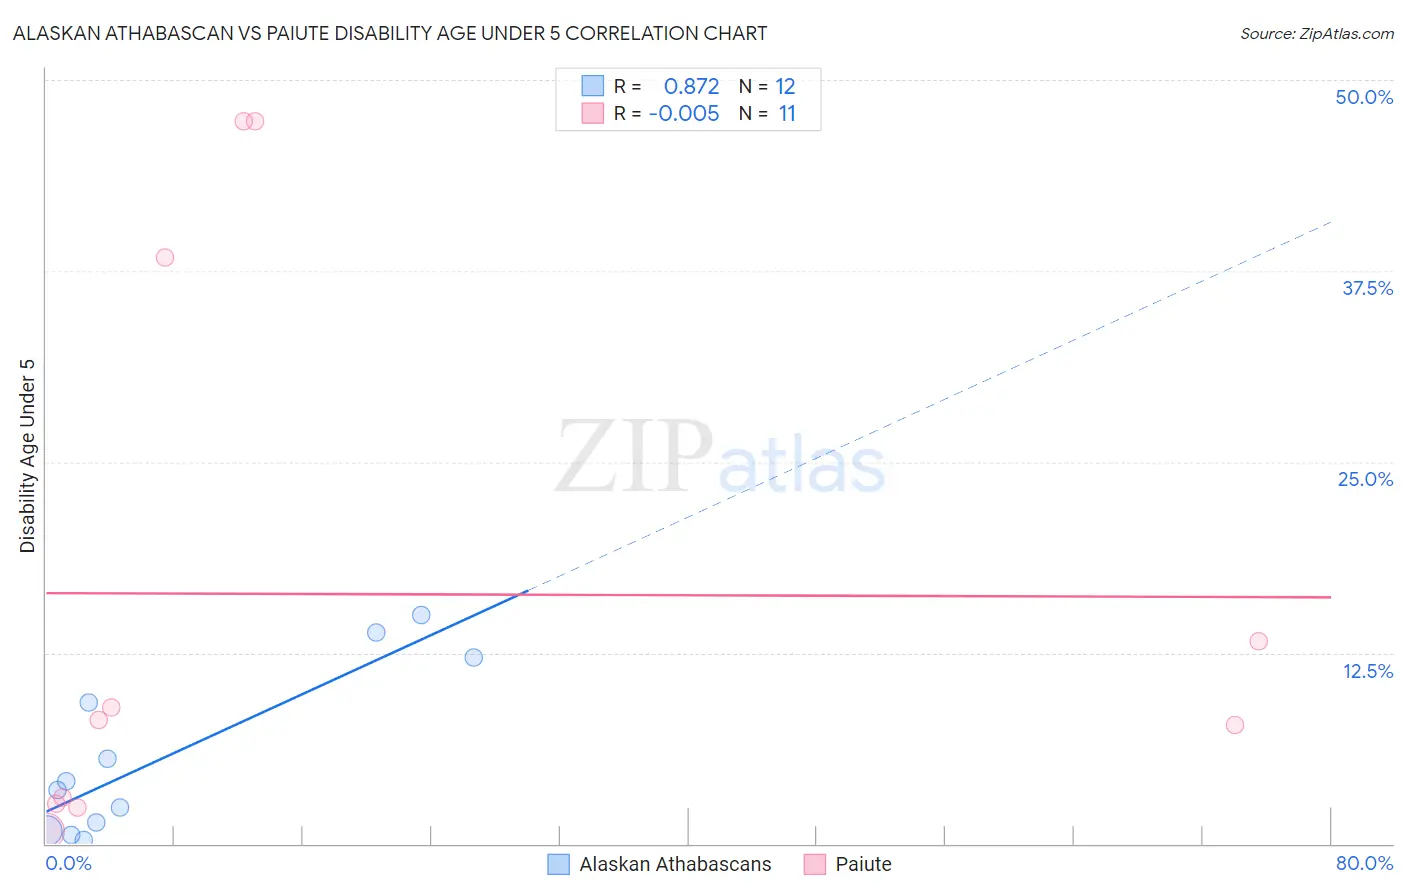
Alaskan Athabascan vs Paiute Disability Age Under 5 Correlation Chart
The statistical analysis conducted on geographies consisting of 36,074,143 people shows a very strong positive correlation between the proportion of Alaskan Athabascans and percentage of population with a disability under the age of 5 in the United States with a correlation coefficient (R) of 0.872 and weighted average of 1.5%. Similarly, the statistical analysis conducted on geographies consisting of 49,758,622 people shows no correlation between the proportion of Paiute and percentage of population with a disability under the age of 5 in the United States with a correlation coefficient (R) of -0.005 and weighted average of 3.9%, a difference of 169.4%.
Disability Age Under 5 Correlation Summary
| Measurement | Alaskan Athabascan | Paiute |
| Minimum | 0.26% | 0.83% |
| Maximum | 15.0% | 47.3% |
| Range | 14.7% | 46.5% |
| Mean | 5.7% | 16.3% |
| Median | 3.8% | 8.1% |
| Interquartile 25% (IQ1) | 1.1% | 2.6% |
| Interquartile 75% (IQ3) | 10.7% | 38.4% |
| Interquartile Range (IQR) | 9.6% | 35.7% |
| Standard Deviation (Sample) | 5.4% | 18.5% |
| Standard Deviation (Population) | 5.2% | 17.6% |
Similar Demographics by Disability Age Under 5
Demographics Similar to Alaskan Athabascans by Disability Age Under 5
In terms of disability age under 5, the demographic groups most similar to Alaskan Athabascans are Iroquois (1.5%, a difference of 0.27%), Black/African American (1.4%, a difference of 0.29%), Brazilian (1.5%, a difference of 0.38%), Immigrants from Canada (1.4%, a difference of 0.46%), and Immigrants from North America (1.4%, a difference of 0.50%).
| Demographics | Rating | Rank | Disability Age Under 5 |
| Immigrants | Germany | 0.1 /100 | #266 | Tragic 1.4% |
| Cree | 0.1 /100 | #267 | Tragic 1.4% |
| Belgians | 0.1 /100 | #268 | Tragic 1.4% |
| Austrians | 0.1 /100 | #269 | Tragic 1.4% |
| Immigrants | North America | 0.1 /100 | #270 | Tragic 1.4% |
| Immigrants | Canada | 0.1 /100 | #271 | Tragic 1.4% |
| Blacks/African Americans | 0.1 /100 | #272 | Tragic 1.4% |
| Alaskan Athabascans | 0.1 /100 | #273 | Tragic 1.5% |
| Iroquois | 0.0 /100 | #274 | Tragic 1.5% |
| Brazilians | 0.0 /100 | #275 | Tragic 1.5% |
| Greeks | 0.0 /100 | #276 | Tragic 1.5% |
| Canadians | 0.0 /100 | #277 | Tragic 1.5% |
| Kiowa | 0.0 /100 | #278 | Tragic 1.5% |
| Danes | 0.0 /100 | #279 | Tragic 1.5% |
| British | 0.0 /100 | #280 | Tragic 1.5% |
Demographics Similar to Paiute by Disability Age Under 5
In terms of disability age under 5, the demographic groups most similar to Paiute are Inupiat (3.7%, a difference of 5.3%), Yup'ik (4.5%, a difference of 15.8%), Hopi (4.6%, a difference of 18.4%), Colville (3.3%, a difference of 19.0%), and Alaska Native (2.9%, a difference of 32.9%).
| Demographics | Rating | Rank | Disability Age Under 5 |
| Dutch West Indians | 0.0 /100 | #333 | Tragic 1.9% |
| Natives/Alaskans | 0.0 /100 | #334 | Tragic 1.9% |
| Pennsylvania Germans | 0.0 /100 | #335 | Tragic 1.9% |
| Paraguayans | 0.0 /100 | #336 | Tragic 2.0% |
| Apache | 0.0 /100 | #337 | Tragic 2.0% |
| Tohono O'odham | 0.0 /100 | #338 | Tragic 2.2% |
| Immigrants | Azores | 0.0 /100 | #339 | Tragic 2.2% |
| Menominee | 0.0 /100 | #340 | Tragic 2.3% |
| Tsimshian | 0.0 /100 | #341 | Tragic 2.4% |
| Alaska Natives | 0.0 /100 | #342 | Tragic 2.9% |
| Colville | 0.0 /100 | #343 | Tragic 3.3% |
| Inupiat | 0.0 /100 | #344 | Tragic 3.7% |
| Paiute | 0.0 /100 | #345 | Tragic 3.9% |
| Yup'ik | 0.0 /100 | #346 | Tragic 4.5% |
| Hopi | 0.0 /100 | #347 | Tragic 4.6% |