Alaskan Athabascan vs Immigrants from Chile Disability Age Under 5
COMPARE
Alaskan Athabascan
Immigrants from Chile
Disability Age Under 5
Disability Age Under 5 Comparison
Alaskan Athabascans
Immigrants from Chile
1.5%
DISABILITY AGE UNDER 5
0.1/ 100
METRIC RATING
273rd/ 347
METRIC RANK
1.3%
DISABILITY AGE UNDER 5
17.2/ 100
METRIC RATING
214th/ 347
METRIC RANK
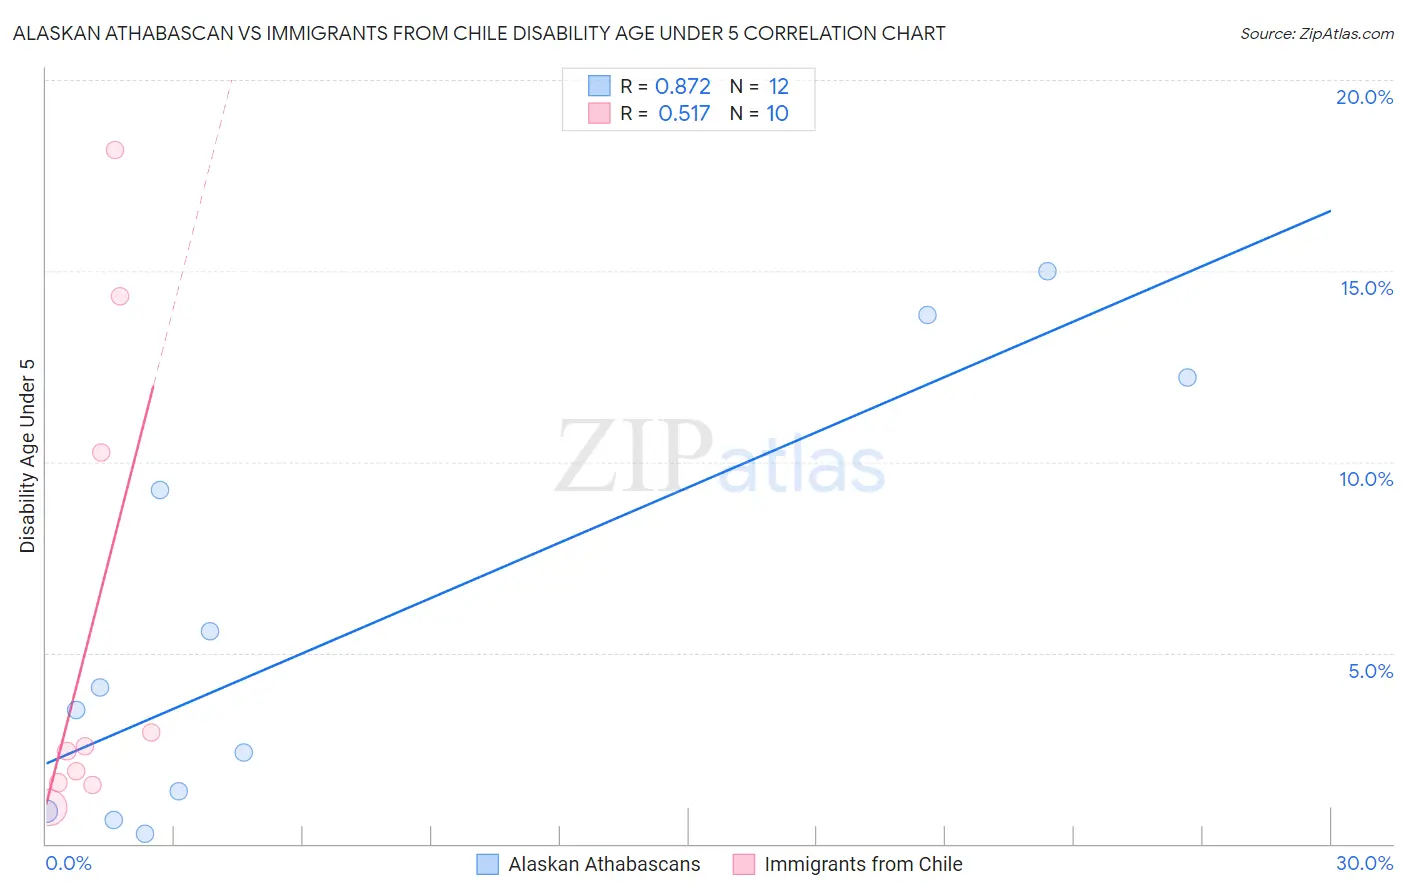
Alaskan Athabascan vs Immigrants from Chile Disability Age Under 5 Correlation Chart
The statistical analysis conducted on geographies consisting of 36,074,143 people shows a very strong positive correlation between the proportion of Alaskan Athabascans and percentage of population with a disability under the age of 5 in the United States with a correlation coefficient (R) of 0.872 and weighted average of 1.5%. Similarly, the statistical analysis conducted on geographies consisting of 142,107,365 people shows a substantial positive correlation between the proportion of Immigrants from Chile and percentage of population with a disability under the age of 5 in the United States with a correlation coefficient (R) of 0.517 and weighted average of 1.3%, a difference of 13.0%.
Disability Age Under 5 Correlation Summary
| Measurement | Alaskan Athabascan | Immigrants from Chile |
| Minimum | 0.26% | 0.94% |
| Maximum | 15.0% | 18.2% |
| Range | 14.7% | 17.2% |
| Mean | 5.7% | 5.7% |
| Median | 3.8% | 2.5% |
| Interquartile 25% (IQ1) | 1.1% | 1.6% |
| Interquartile 75% (IQ3) | 10.7% | 10.2% |
| Interquartile Range (IQR) | 9.6% | 8.6% |
| Standard Deviation (Sample) | 5.4% | 6.2% |
| Standard Deviation (Population) | 5.2% | 5.9% |
Similar Demographics by Disability Age Under 5
Demographics Similar to Alaskan Athabascans by Disability Age Under 5
In terms of disability age under 5, the demographic groups most similar to Alaskan Athabascans are Iroquois (1.5%, a difference of 0.27%), Black/African American (1.4%, a difference of 0.29%), Brazilian (1.5%, a difference of 0.38%), Immigrants from Canada (1.4%, a difference of 0.46%), and Immigrants from North America (1.4%, a difference of 0.50%).
| Demographics | Rating | Rank | Disability Age Under 5 |
| Immigrants | Germany | 0.1 /100 | #266 | Tragic 1.4% |
| Cree | 0.1 /100 | #267 | Tragic 1.4% |
| Belgians | 0.1 /100 | #268 | Tragic 1.4% |
| Austrians | 0.1 /100 | #269 | Tragic 1.4% |
| Immigrants | North America | 0.1 /100 | #270 | Tragic 1.4% |
| Immigrants | Canada | 0.1 /100 | #271 | Tragic 1.4% |
| Blacks/African Americans | 0.1 /100 | #272 | Tragic 1.4% |
| Alaskan Athabascans | 0.1 /100 | #273 | Tragic 1.5% |
| Iroquois | 0.0 /100 | #274 | Tragic 1.5% |
| Brazilians | 0.0 /100 | #275 | Tragic 1.5% |
| Greeks | 0.0 /100 | #276 | Tragic 1.5% |
| Canadians | 0.0 /100 | #277 | Tragic 1.5% |
| Kiowa | 0.0 /100 | #278 | Tragic 1.5% |
| Danes | 0.0 /100 | #279 | Tragic 1.5% |
| British | 0.0 /100 | #280 | Tragic 1.5% |
Demographics Similar to Immigrants from Chile by Disability Age Under 5
In terms of disability age under 5, the demographic groups most similar to Immigrants from Chile are Syrian (1.3%, a difference of 0.17%), Immigrants from Sudan (1.3%, a difference of 0.23%), Chilean (1.3%, a difference of 0.24%), Bangladeshi (1.3%, a difference of 0.27%), and Immigrants from Greece (1.3%, a difference of 0.29%).
| Demographics | Rating | Rank | Disability Age Under 5 |
| Nigerians | 21.2 /100 | #207 | Fair 1.3% |
| Mexicans | 20.8 /100 | #208 | Fair 1.3% |
| Bulgarians | 19.5 /100 | #209 | Poor 1.3% |
| Pakistanis | 19.4 /100 | #210 | Poor 1.3% |
| Immigrants | Greece | 19.1 /100 | #211 | Poor 1.3% |
| Chileans | 18.8 /100 | #212 | Poor 1.3% |
| Immigrants | Sudan | 18.7 /100 | #213 | Poor 1.3% |
| Immigrants | Chile | 17.2 /100 | #214 | Poor 1.3% |
| Syrians | 16.1 /100 | #215 | Poor 1.3% |
| Bangladeshis | 15.5 /100 | #216 | Poor 1.3% |
| Cypriots | 14.9 /100 | #217 | Poor 1.3% |
| Malaysians | 13.2 /100 | #218 | Poor 1.3% |
| Immigrants | Croatia | 11.2 /100 | #219 | Poor 1.3% |
| Serbians | 9.6 /100 | #220 | Tragic 1.3% |
| Sub-Saharan Africans | 8.3 /100 | #221 | Tragic 1.3% |