Immigrants from Romania vs Paiute Disability Age Under 5
COMPARE
Immigrants from Romania
Paiute
Disability Age Under 5
Disability Age Under 5 Comparison
Immigrants from Romania
Paiute
1.2%
DISABILITY AGE UNDER 5
88.4/ 100
METRIC RATING
127th/ 347
METRIC RANK
3.9%
DISABILITY AGE UNDER 5
0.0/ 100
METRIC RATING
345th/ 347
METRIC RANK
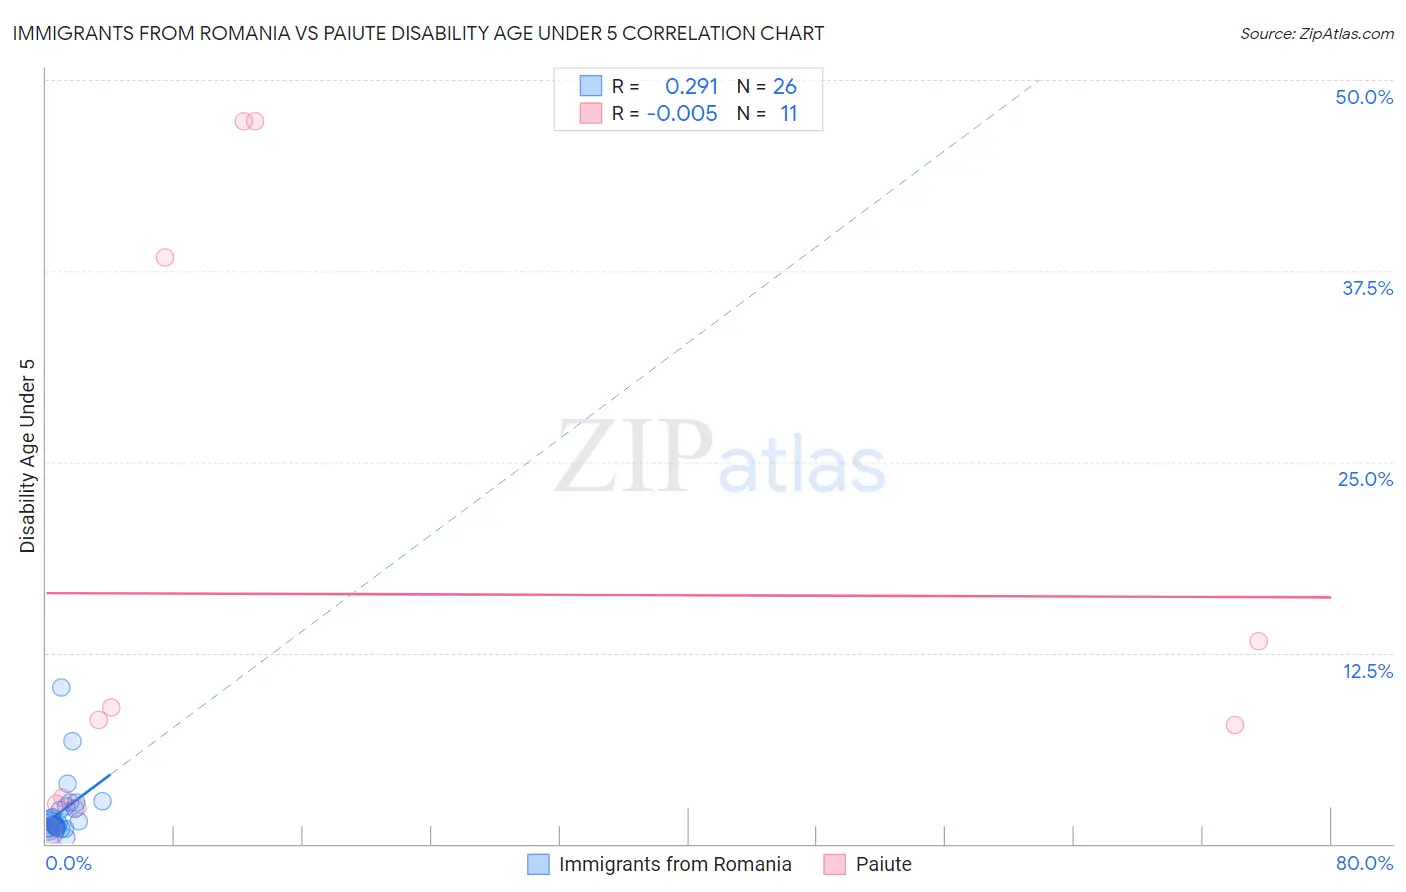
Immigrants from Romania vs Paiute Disability Age Under 5 Correlation Chart
The statistical analysis conducted on geographies consisting of 156,467,969 people shows a weak positive correlation between the proportion of Immigrants from Romania and percentage of population with a disability under the age of 5 in the United States with a correlation coefficient (R) of 0.291 and weighted average of 1.2%. Similarly, the statistical analysis conducted on geographies consisting of 49,758,622 people shows no correlation between the proportion of Paiute and percentage of population with a disability under the age of 5 in the United States with a correlation coefficient (R) of -0.005 and weighted average of 3.9%, a difference of 230.4%.
Disability Age Under 5 Correlation Summary
| Measurement | Immigrants from Romania | Paiute |
| Minimum | 0.37% | 0.83% |
| Maximum | 10.3% | 47.3% |
| Range | 9.9% | 46.5% |
| Mean | 2.2% | 16.3% |
| Median | 1.4% | 8.1% |
| Interquartile 25% (IQ1) | 1.1% | 2.6% |
| Interquartile 75% (IQ3) | 2.4% | 38.4% |
| Interquartile Range (IQR) | 1.4% | 35.7% |
| Standard Deviation (Sample) | 2.1% | 18.5% |
| Standard Deviation (Population) | 2.0% | 17.6% |
Similar Demographics by Disability Age Under 5
Demographics Similar to Immigrants from Romania by Disability Age Under 5
In terms of disability age under 5, the demographic groups most similar to Immigrants from Romania are Immigrants from France (1.2%, a difference of 0.0%), Immigrants (1.2%, a difference of 0.090%), Korean (1.2%, a difference of 0.17%), Immigrants from Serbia (1.2%, a difference of 0.19%), and Immigrants from Eastern Europe (1.2%, a difference of 0.26%).
| Demographics | Rating | Rank | Disability Age Under 5 |
| Immigrants | Eritrea | 92.3 /100 | #120 | Exceptional 1.2% |
| Immigrants | Senegal | 91.4 /100 | #121 | Exceptional 1.2% |
| Aleuts | 90.7 /100 | #122 | Exceptional 1.2% |
| Zimbabweans | 90.6 /100 | #123 | Exceptional 1.2% |
| Immigrants | Cambodia | 90.5 /100 | #124 | Exceptional 1.2% |
| Japanese | 90.3 /100 | #125 | Exceptional 1.2% |
| Central Americans | 89.7 /100 | #126 | Excellent 1.2% |
| Immigrants | Romania | 88.4 /100 | #127 | Excellent 1.2% |
| Immigrants | France | 88.4 /100 | #128 | Excellent 1.2% |
| Immigrants | Immigrants | 88.0 /100 | #129 | Excellent 1.2% |
| Koreans | 87.7 /100 | #130 | Excellent 1.2% |
| Immigrants | Serbia | 87.6 /100 | #131 | Excellent 1.2% |
| Immigrants | Eastern Europe | 87.3 /100 | #132 | Excellent 1.2% |
| Immigrants | Spain | 86.5 /100 | #133 | Excellent 1.2% |
| Argentineans | 85.7 /100 | #134 | Excellent 1.2% |
Demographics Similar to Paiute by Disability Age Under 5
In terms of disability age under 5, the demographic groups most similar to Paiute are Inupiat (3.7%, a difference of 5.3%), Yup'ik (4.5%, a difference of 15.8%), Hopi (4.6%, a difference of 18.4%), Colville (3.3%, a difference of 19.0%), and Alaska Native (2.9%, a difference of 32.9%).
| Demographics | Rating | Rank | Disability Age Under 5 |
| Dutch West Indians | 0.0 /100 | #333 | Tragic 1.9% |
| Natives/Alaskans | 0.0 /100 | #334 | Tragic 1.9% |
| Pennsylvania Germans | 0.0 /100 | #335 | Tragic 1.9% |
| Paraguayans | 0.0 /100 | #336 | Tragic 2.0% |
| Apache | 0.0 /100 | #337 | Tragic 2.0% |
| Tohono O'odham | 0.0 /100 | #338 | Tragic 2.2% |
| Immigrants | Azores | 0.0 /100 | #339 | Tragic 2.2% |
| Menominee | 0.0 /100 | #340 | Tragic 2.3% |
| Tsimshian | 0.0 /100 | #341 | Tragic 2.4% |
| Alaska Natives | 0.0 /100 | #342 | Tragic 2.9% |
| Colville | 0.0 /100 | #343 | Tragic 3.3% |
| Inupiat | 0.0 /100 | #344 | Tragic 3.7% |
| Paiute | 0.0 /100 | #345 | Tragic 3.9% |
| Yup'ik | 0.0 /100 | #346 | Tragic 4.5% |
| Hopi | 0.0 /100 | #347 | Tragic 4.6% |