Alaskan Athabascan vs Immigrants from Russia Disability Age Under 5
COMPARE
Alaskan Athabascan
Immigrants from Russia
Disability Age Under 5
Disability Age Under 5 Comparison
Alaskan Athabascans
Immigrants from Russia
1.5%
DISABILITY AGE UNDER 5
0.1/ 100
METRIC RATING
273rd/ 347
METRIC RANK
1.1%
DISABILITY AGE UNDER 5
99.7/ 100
METRIC RATING
49th/ 347
METRIC RANK
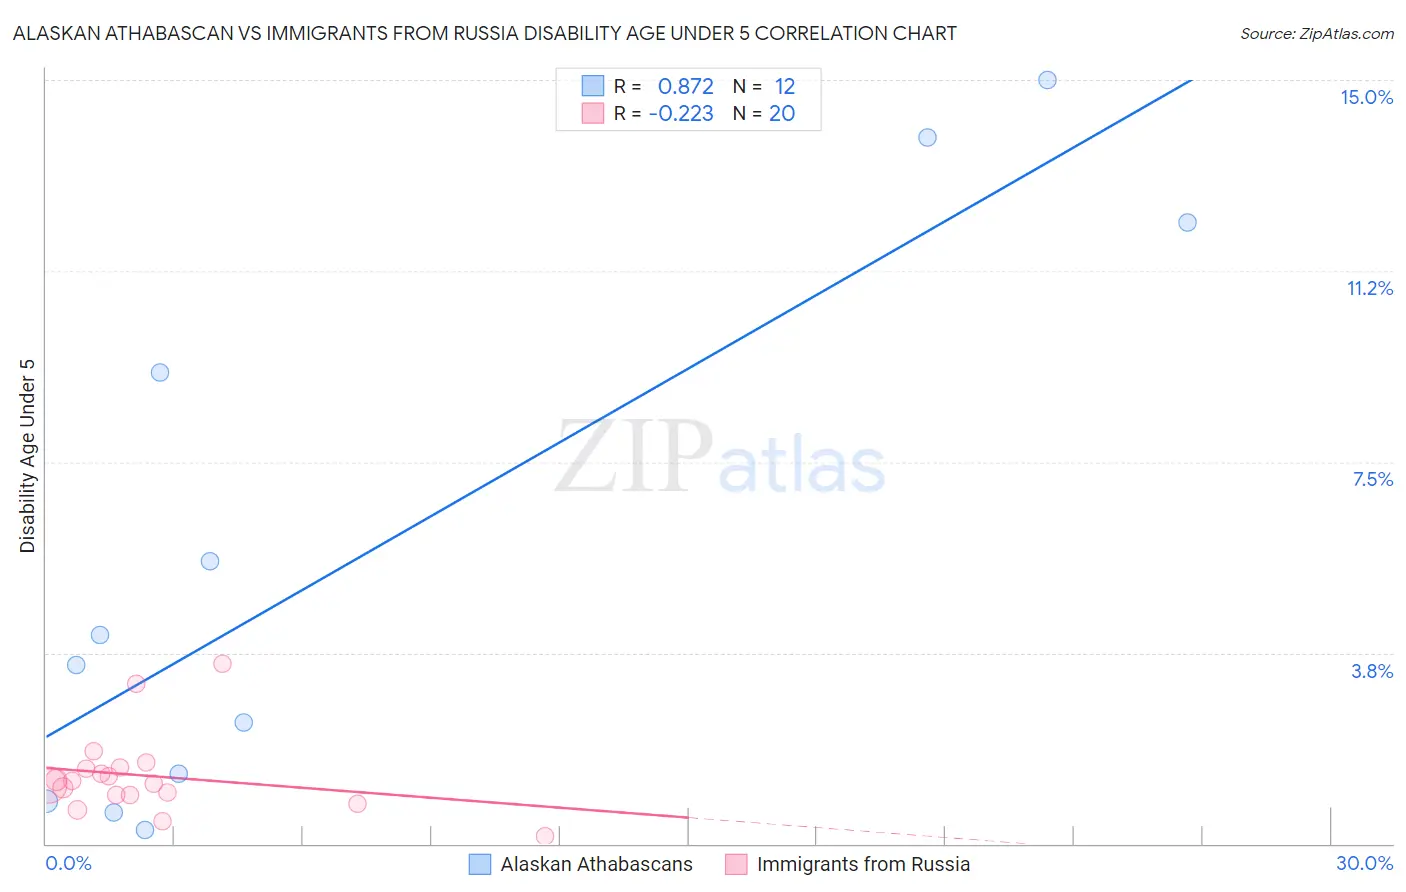
Alaskan Athabascan vs Immigrants from Russia Disability Age Under 5 Correlation Chart
The statistical analysis conducted on geographies consisting of 36,074,143 people shows a very strong positive correlation between the proportion of Alaskan Athabascans and percentage of population with a disability under the age of 5 in the United States with a correlation coefficient (R) of 0.872 and weighted average of 1.5%. Similarly, the statistical analysis conducted on geographies consisting of 192,972,084 people shows a weak negative correlation between the proportion of Immigrants from Russia and percentage of population with a disability under the age of 5 in the United States with a correlation coefficient (R) of -0.223 and weighted average of 1.1%, a difference of 34.9%.
Disability Age Under 5 Correlation Summary
| Measurement | Alaskan Athabascan | Immigrants from Russia |
| Minimum | 0.26% | 0.14% |
| Maximum | 15.0% | 3.5% |
| Range | 14.7% | 3.4% |
| Mean | 5.7% | 1.3% |
| Median | 3.8% | 1.2% |
| Interquartile 25% (IQ1) | 1.1% | 0.95% |
| Interquartile 75% (IQ3) | 10.7% | 1.5% |
| Interquartile Range (IQR) | 9.6% | 0.53% |
| Standard Deviation (Sample) | 5.4% | 0.79% |
| Standard Deviation (Population) | 5.2% | 0.77% |
Similar Demographics by Disability Age Under 5
Demographics Similar to Alaskan Athabascans by Disability Age Under 5
In terms of disability age under 5, the demographic groups most similar to Alaskan Athabascans are Iroquois (1.5%, a difference of 0.27%), Black/African American (1.4%, a difference of 0.29%), Brazilian (1.5%, a difference of 0.38%), Immigrants from Canada (1.4%, a difference of 0.46%), and Immigrants from North America (1.4%, a difference of 0.50%).
| Demographics | Rating | Rank | Disability Age Under 5 |
| Immigrants | Germany | 0.1 /100 | #266 | Tragic 1.4% |
| Cree | 0.1 /100 | #267 | Tragic 1.4% |
| Belgians | 0.1 /100 | #268 | Tragic 1.4% |
| Austrians | 0.1 /100 | #269 | Tragic 1.4% |
| Immigrants | North America | 0.1 /100 | #270 | Tragic 1.4% |
| Immigrants | Canada | 0.1 /100 | #271 | Tragic 1.4% |
| Blacks/African Americans | 0.1 /100 | #272 | Tragic 1.4% |
| Alaskan Athabascans | 0.1 /100 | #273 | Tragic 1.5% |
| Iroquois | 0.0 /100 | #274 | Tragic 1.5% |
| Brazilians | 0.0 /100 | #275 | Tragic 1.5% |
| Greeks | 0.0 /100 | #276 | Tragic 1.5% |
| Canadians | 0.0 /100 | #277 | Tragic 1.5% |
| Kiowa | 0.0 /100 | #278 | Tragic 1.5% |
| Danes | 0.0 /100 | #279 | Tragic 1.5% |
| British | 0.0 /100 | #280 | Tragic 1.5% |
Demographics Similar to Immigrants from Russia by Disability Age Under 5
In terms of disability age under 5, the demographic groups most similar to Immigrants from Russia are Immigrants from Japan (1.1%, a difference of 0.020%), Immigrants from Kazakhstan (1.1%, a difference of 0.20%), Immigrants from Singapore (1.1%, a difference of 0.21%), Immigrants from Sweden (1.1%, a difference of 0.43%), and Immigrants from Congo (1.1%, a difference of 0.57%).
| Demographics | Rating | Rank | Disability Age Under 5 |
| Immigrants | Bulgaria | 99.8 /100 | #42 | Exceptional 1.1% |
| Pima | 99.8 /100 | #43 | Exceptional 1.1% |
| Immigrants | Asia | 99.8 /100 | #44 | Exceptional 1.1% |
| Immigrants | Turkey | 99.8 /100 | #45 | Exceptional 1.1% |
| Immigrants | Congo | 99.8 /100 | #46 | Exceptional 1.1% |
| Immigrants | Sweden | 99.8 /100 | #47 | Exceptional 1.1% |
| Immigrants | Singapore | 99.7 /100 | #48 | Exceptional 1.1% |
| Immigrants | Russia | 99.7 /100 | #49 | Exceptional 1.1% |
| Immigrants | Japan | 99.7 /100 | #50 | Exceptional 1.1% |
| Immigrants | Kazakhstan | 99.7 /100 | #51 | Exceptional 1.1% |
| Immigrants | Bolivia | 99.6 /100 | #52 | Exceptional 1.1% |
| Asians | 99.6 /100 | #53 | Exceptional 1.1% |
| Immigrants | El Salvador | 99.6 /100 | #54 | Exceptional 1.1% |
| Salvadorans | 99.5 /100 | #55 | Exceptional 1.1% |
| Ecuadorians | 99.5 /100 | #56 | Exceptional 1.1% |