Alaskan Athabascan vs Paiute Disability Age 35 to 64
COMPARE
Alaskan Athabascan
Paiute
Disability Age 35 to 64
Disability Age 35 to 64 Comparison
Alaskan Athabascans
Paiute
15.7%
DISABILITY AGE 35 TO 64
0.0/ 100
METRIC RATING
332nd/ 347
METRIC RANK
14.3%
DISABILITY AGE 35 TO 64
0.0/ 100
METRIC RATING
312th/ 347
METRIC RANK
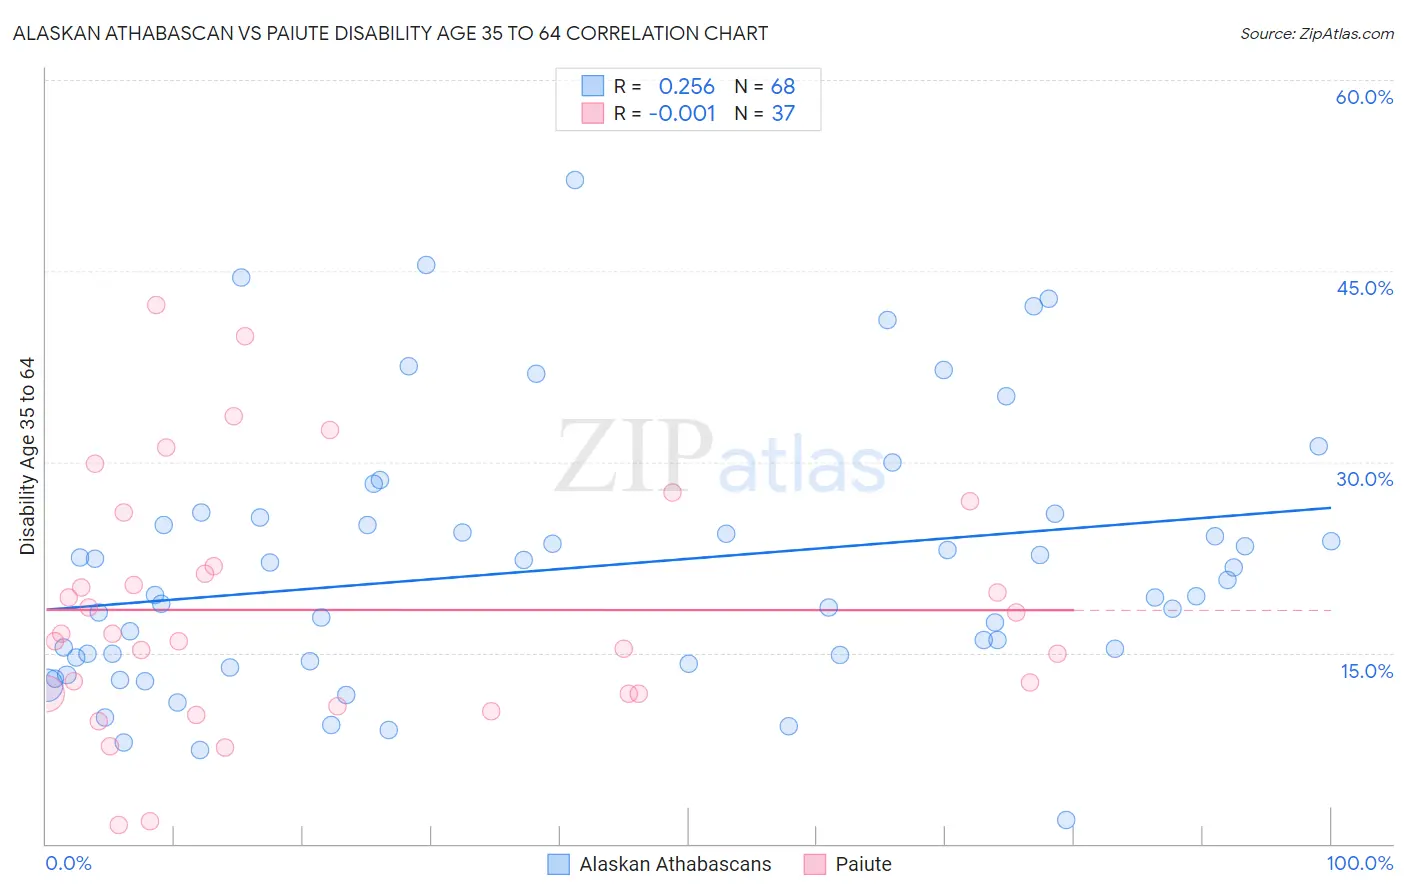
Alaskan Athabascan vs Paiute Disability Age 35 to 64 Correlation Chart
The statistical analysis conducted on geographies consisting of 45,816,251 people shows a weak positive correlation between the proportion of Alaskan Athabascans and percentage of population with a disability between the ages 34 and 64 in the United States with a correlation coefficient (R) of 0.256 and weighted average of 15.7%. Similarly, the statistical analysis conducted on geographies consisting of 58,391,791 people shows no correlation between the proportion of Paiute and percentage of population with a disability between the ages 34 and 64 in the United States with a correlation coefficient (R) of -0.001 and weighted average of 14.3%, a difference of 10.0%.
Disability Age 35 to 64 Correlation Summary
| Measurement | Alaskan Athabascan | Paiute |
| Minimum | 1.9% | 1.4% |
| Maximum | 52.2% | 42.3% |
| Range | 50.3% | 40.9% |
| Mean | 21.7% | 18.4% |
| Median | 19.5% | 16.5% |
| Interquartile 25% (IQ1) | 14.5% | 11.8% |
| Interquartile 75% (IQ3) | 25.4% | 23.9% |
| Interquartile Range (IQR) | 10.9% | 12.2% |
| Standard Deviation (Sample) | 10.3% | 9.6% |
| Standard Deviation (Population) | 10.3% | 9.5% |
Demographics Similar to Alaskan Athabascans and Paiute by Disability Age 35 to 64
In terms of disability age 35 to 64, the demographic groups most similar to Alaskan Athabascans are Dutch West Indian (15.6%, a difference of 0.59%), Navajo (15.5%, a difference of 1.5%), Cherokee (15.5%, a difference of 1.7%), Cajun (15.3%, a difference of 2.5%), and Pueblo (15.3%, a difference of 2.7%). Similarly, the demographic groups most similar to Paiute are Iroquois (14.4%, a difference of 0.44%), Shoshone (14.5%, a difference of 1.2%), Alaska Native (14.5%, a difference of 1.2%), Osage (14.5%, a difference of 1.4%), and Crow (14.6%, a difference of 2.3%).
| Demographics | Rating | Rank | Disability Age 35 to 64 |
| Paiute | 0.0 /100 | #312 | Tragic 14.3% |
| Iroquois | 0.0 /100 | #313 | Tragic 14.4% |
| Shoshone | 0.0 /100 | #314 | Tragic 14.5% |
| Alaska Natives | 0.0 /100 | #315 | Tragic 14.5% |
| Osage | 0.0 /100 | #316 | Tragic 14.5% |
| Crow | 0.0 /100 | #317 | Tragic 14.6% |
| Ottawa | 0.0 /100 | #318 | Tragic 14.6% |
| Immigrants | Cabo Verde | 0.0 /100 | #319 | Tragic 14.7% |
| Blacks/African Americans | 0.0 /100 | #320 | Tragic 14.7% |
| Comanche | 0.0 /100 | #321 | Tragic 14.7% |
| Potawatomi | 0.0 /100 | #322 | Tragic 14.8% |
| Apache | 0.0 /100 | #323 | Tragic 14.9% |
| Chippewa | 0.0 /100 | #324 | Tragic 15.0% |
| Arapaho | 0.0 /100 | #325 | Tragic 15.1% |
| Natives/Alaskans | 0.0 /100 | #326 | Tragic 15.3% |
| Pueblo | 0.0 /100 | #327 | Tragic 15.3% |
| Cajuns | 0.0 /100 | #328 | Tragic 15.3% |
| Cherokee | 0.0 /100 | #329 | Tragic 15.5% |
| Navajo | 0.0 /100 | #330 | Tragic 15.5% |
| Dutch West Indians | 0.0 /100 | #331 | Tragic 15.6% |
| Alaskan Athabascans | 0.0 /100 | #332 | Tragic 15.7% |