Immigrants from Ecuador vs Immigrants from Russia Disability Age Under 5
COMPARE
Immigrants from Ecuador
Immigrants from Russia
Disability Age Under 5
Disability Age Under 5 Comparison
Immigrants from Ecuador
Immigrants from Russia
1.1%
DISABILITY AGE UNDER 5
98.6/ 100
METRIC RATING
70th/ 347
METRIC RANK
1.1%
DISABILITY AGE UNDER 5
99.7/ 100
METRIC RATING
49th/ 347
METRIC RANK
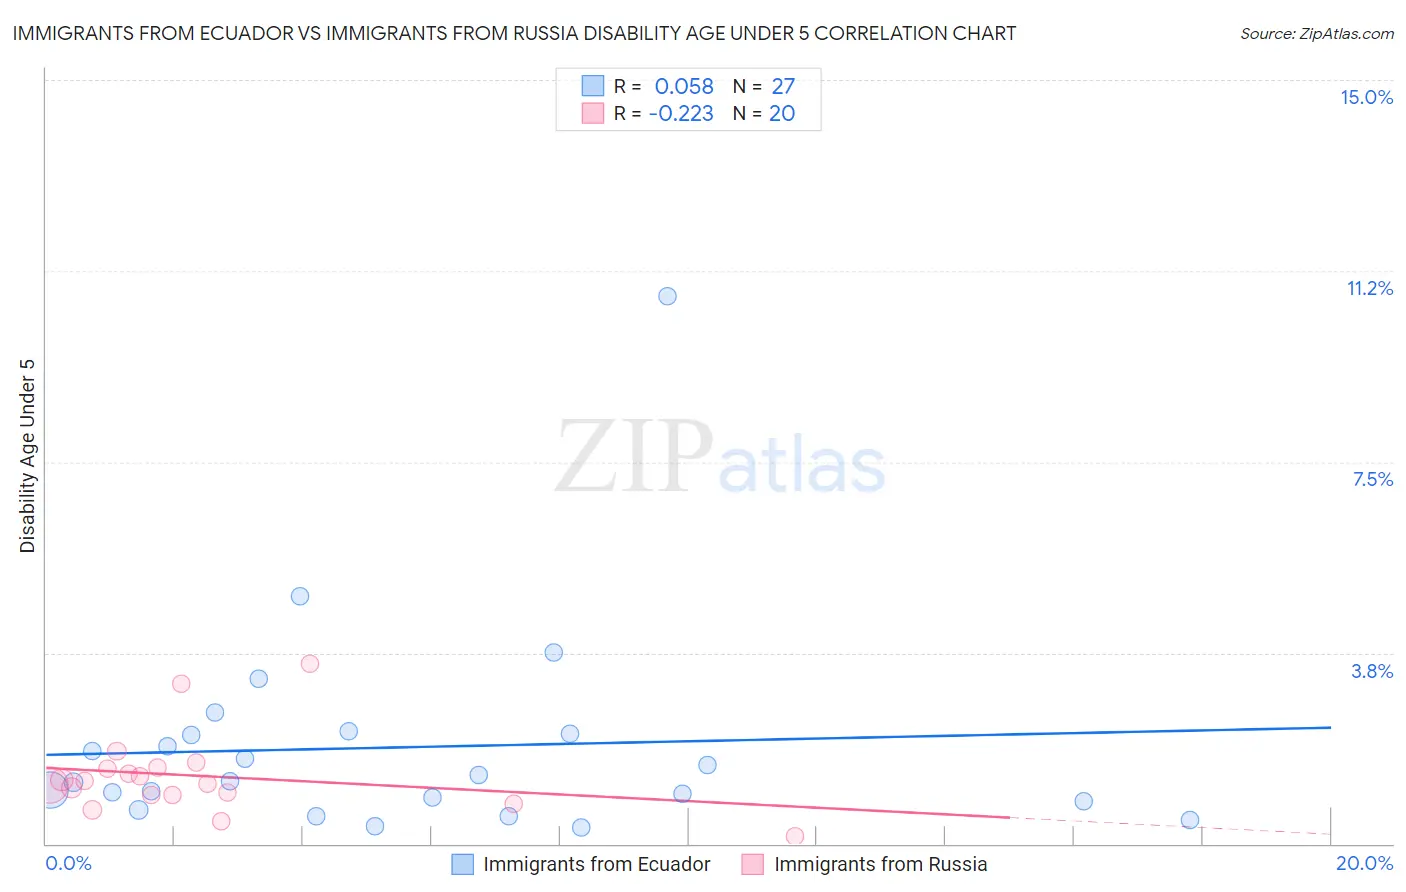
Immigrants from Ecuador vs Immigrants from Russia Disability Age Under 5 Correlation Chart
The statistical analysis conducted on geographies consisting of 164,756,181 people shows a slight positive correlation between the proportion of Immigrants from Ecuador and percentage of population with a disability under the age of 5 in the United States with a correlation coefficient (R) of 0.058 and weighted average of 1.1%. Similarly, the statistical analysis conducted on geographies consisting of 192,972,084 people shows a weak negative correlation between the proportion of Immigrants from Russia and percentage of population with a disability under the age of 5 in the United States with a correlation coefficient (R) of -0.223 and weighted average of 1.1%, a difference of 4.2%.
Disability Age Under 5 Correlation Summary
| Measurement | Immigrants from Ecuador | Immigrants from Russia |
| Minimum | 0.33% | 0.14% |
| Maximum | 10.7% | 3.5% |
| Range | 10.4% | 3.4% |
| Mean | 1.9% | 1.3% |
| Median | 1.2% | 1.2% |
| Interquartile 25% (IQ1) | 0.82% | 0.95% |
| Interquartile 75% (IQ3) | 2.2% | 1.5% |
| Interquartile Range (IQR) | 1.3% | 0.53% |
| Standard Deviation (Sample) | 2.1% | 0.79% |
| Standard Deviation (Population) | 2.0% | 0.77% |
Similar Demographics by Disability Age Under 5
Demographics Similar to Immigrants from Ecuador by Disability Age Under 5
In terms of disability age under 5, the demographic groups most similar to Immigrants from Ecuador are Trinidadian and Tobagonian (1.1%, a difference of 0.060%), Israeli (1.1%, a difference of 0.090%), South African (1.1%, a difference of 0.11%), Immigrants from Belize (1.1%, a difference of 0.15%), and Immigrants from Indonesia (1.1%, a difference of 0.22%).
| Demographics | Rating | Rank | Disability Age Under 5 |
| Immigrants | Vietnam | 99.1 /100 | #63 | Exceptional 1.1% |
| Egyptians | 98.9 /100 | #64 | Exceptional 1.1% |
| Immigrants | Korea | 98.8 /100 | #65 | Exceptional 1.1% |
| Immigrants | Indonesia | 98.7 /100 | #66 | Exceptional 1.1% |
| Immigrants | Belize | 98.7 /100 | #67 | Exceptional 1.1% |
| South Africans | 98.7 /100 | #68 | Exceptional 1.1% |
| Israelis | 98.7 /100 | #69 | Exceptional 1.1% |
| Immigrants | Ecuador | 98.6 /100 | #70 | Exceptional 1.1% |
| Trinidadians and Tobagonians | 98.6 /100 | #71 | Exceptional 1.1% |
| Burmese | 98.5 /100 | #72 | Exceptional 1.1% |
| Immigrants | Sri Lanka | 98.5 /100 | #73 | Exceptional 1.1% |
| Jordanians | 98.5 /100 | #74 | Exceptional 1.1% |
| Immigrants | Pakistan | 98.4 /100 | #75 | Exceptional 1.1% |
| Immigrants | Burma/Myanmar | 98.2 /100 | #76 | Exceptional 1.1% |
| Immigrants | Denmark | 98.1 /100 | #77 | Exceptional 1.1% |
Demographics Similar to Immigrants from Russia by Disability Age Under 5
In terms of disability age under 5, the demographic groups most similar to Immigrants from Russia are Immigrants from Japan (1.1%, a difference of 0.020%), Immigrants from Kazakhstan (1.1%, a difference of 0.20%), Immigrants from Singapore (1.1%, a difference of 0.21%), Immigrants from Sweden (1.1%, a difference of 0.43%), and Immigrants from Congo (1.1%, a difference of 0.57%).
| Demographics | Rating | Rank | Disability Age Under 5 |
| Immigrants | Bulgaria | 99.8 /100 | #42 | Exceptional 1.1% |
| Pima | 99.8 /100 | #43 | Exceptional 1.1% |
| Immigrants | Asia | 99.8 /100 | #44 | Exceptional 1.1% |
| Immigrants | Turkey | 99.8 /100 | #45 | Exceptional 1.1% |
| Immigrants | Congo | 99.8 /100 | #46 | Exceptional 1.1% |
| Immigrants | Sweden | 99.8 /100 | #47 | Exceptional 1.1% |
| Immigrants | Singapore | 99.7 /100 | #48 | Exceptional 1.1% |
| Immigrants | Russia | 99.7 /100 | #49 | Exceptional 1.1% |
| Immigrants | Japan | 99.7 /100 | #50 | Exceptional 1.1% |
| Immigrants | Kazakhstan | 99.7 /100 | #51 | Exceptional 1.1% |
| Immigrants | Bolivia | 99.6 /100 | #52 | Exceptional 1.1% |
| Asians | 99.6 /100 | #53 | Exceptional 1.1% |
| Immigrants | El Salvador | 99.6 /100 | #54 | Exceptional 1.1% |
| Salvadorans | 99.5 /100 | #55 | Exceptional 1.1% |
| Ecuadorians | 99.5 /100 | #56 | Exceptional 1.1% |