Alaskan Athabascan vs Immigrants from Croatia Unemployment Among Women with Children Under 6 years
COMPARE
Alaskan Athabascan
Immigrants from Croatia
Unemployment Among Women with Children Under 6 years
Unemployment Among Women with Children Under 6 years Comparison
Alaskan Athabascans
Immigrants from Croatia
9.1%
UNEMPLOYMENT AMONG WOMEN WITH CHILDREN UNDER 6 YEARS
0.0/ 100
METRIC RATING
305th/ 347
METRIC RANK
7.1%
UNEMPLOYMENT AMONG WOMEN WITH CHILDREN UNDER 6 YEARS
98.9/ 100
METRIC RATING
77th/ 347
METRIC RANK
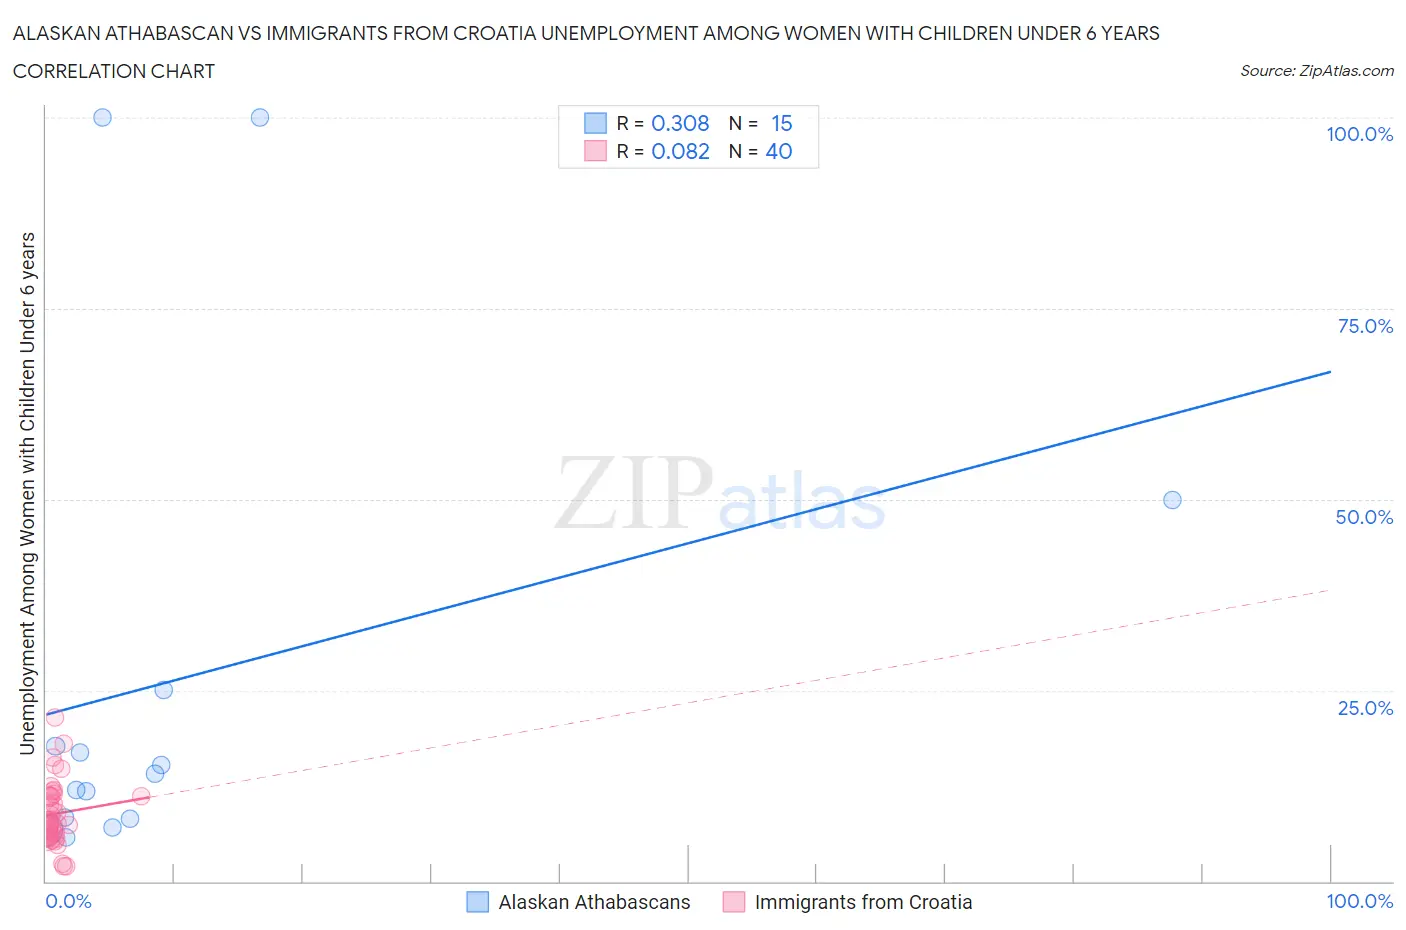
Alaskan Athabascan vs Immigrants from Croatia Unemployment Among Women with Children Under 6 years Correlation Chart
The statistical analysis conducted on geographies consisting of 41,393,771 people shows a mild positive correlation between the proportion of Alaskan Athabascans and unemployment rate among women with children under the age of 6 in the United States with a correlation coefficient (R) of 0.308 and weighted average of 9.1%. Similarly, the statistical analysis conducted on geographies consisting of 114,346,800 people shows a slight positive correlation between the proportion of Immigrants from Croatia and unemployment rate among women with children under the age of 6 in the United States with a correlation coefficient (R) of 0.082 and weighted average of 7.1%, a difference of 28.6%.
Unemployment Among Women with Children Under 6 years Correlation Summary
| Measurement | Alaskan Athabascan | Immigrants from Croatia |
| Minimum | 5.7% | 1.9% |
| Maximum | 100.0% | 21.4% |
| Range | 94.3% | 19.5% |
| Mean | 26.6% | 8.8% |
| Median | 14.1% | 7.6% |
| Interquartile 25% (IQ1) | 8.2% | 6.1% |
| Interquartile 75% (IQ3) | 25.0% | 11.2% |
| Interquartile Range (IQR) | 16.8% | 5.1% |
| Standard Deviation (Sample) | 31.7% | 4.2% |
| Standard Deviation (Population) | 30.7% | 4.2% |
Similar Demographics by Unemployment Among Women with Children Under 6 years
Demographics Similar to Alaskan Athabascans by Unemployment Among Women with Children Under 6 years
In terms of unemployment among women with children under 6 years, the demographic groups most similar to Alaskan Athabascans are Pueblo (9.1%, a difference of 0.17%), Dominican (9.1%, a difference of 0.29%), Immigrants from Micronesia (9.1%, a difference of 0.36%), Immigrants from Mexico (9.1%, a difference of 0.41%), and Immigrants from West Indies (9.0%, a difference of 0.55%).
| Demographics | Rating | Rank | Unemployment Among Women with Children Under 6 years |
| Tlingit-Haida | 0.0 /100 | #298 | Tragic 8.9% |
| Immigrants | Jamaica | 0.0 /100 | #299 | Tragic 8.9% |
| Creek | 0.0 /100 | #300 | Tragic 8.9% |
| Chickasaw | 0.0 /100 | #301 | Tragic 9.0% |
| Hispanics or Latinos | 0.0 /100 | #302 | Tragic 9.0% |
| Immigrants | West Indies | 0.0 /100 | #303 | Tragic 9.0% |
| Immigrants | Mexico | 0.0 /100 | #304 | Tragic 9.1% |
| Alaskan Athabascans | 0.0 /100 | #305 | Tragic 9.1% |
| Pueblo | 0.0 /100 | #306 | Tragic 9.1% |
| Dominicans | 0.0 /100 | #307 | Tragic 9.1% |
| Immigrants | Micronesia | 0.0 /100 | #308 | Tragic 9.1% |
| Africans | 0.0 /100 | #309 | Tragic 9.2% |
| Cajuns | 0.0 /100 | #310 | Tragic 9.2% |
| French American Indians | 0.0 /100 | #311 | Tragic 9.2% |
| Immigrants | Azores | 0.0 /100 | #312 | Tragic 9.2% |
Demographics Similar to Immigrants from Croatia by Unemployment Among Women with Children Under 6 years
In terms of unemployment among women with children under 6 years, the demographic groups most similar to Immigrants from Croatia are Estonian (7.1%, a difference of 0.030%), Immigrants from Somalia (7.1%, a difference of 0.040%), Immigrants from Eastern Europe (7.1%, a difference of 0.080%), Immigrants from Fiji (7.1%, a difference of 0.090%), and Immigrants from Greece (7.1%, a difference of 0.11%).
| Demographics | Rating | Rank | Unemployment Among Women with Children Under 6 years |
| Immigrants | Iraq | 99.4 /100 | #70 | Exceptional 7.0% |
| Afghans | 99.4 /100 | #71 | Exceptional 7.0% |
| Cubans | 99.4 /100 | #72 | Exceptional 7.0% |
| Immigrants | Czechoslovakia | 99.2 /100 | #73 | Exceptional 7.0% |
| Turks | 99.2 /100 | #74 | Exceptional 7.0% |
| Immigrants | Eastern Europe | 99.0 /100 | #75 | Exceptional 7.1% |
| Estonians | 99.0 /100 | #76 | Exceptional 7.1% |
| Immigrants | Croatia | 98.9 /100 | #77 | Exceptional 7.1% |
| Immigrants | Somalia | 98.9 /100 | #78 | Exceptional 7.1% |
| Immigrants | Fiji | 98.9 /100 | #79 | Exceptional 7.1% |
| Immigrants | Greece | 98.9 /100 | #80 | Exceptional 7.1% |
| Immigrants | Venezuela | 98.8 /100 | #81 | Exceptional 7.1% |
| Immigrants | Afghanistan | 98.7 /100 | #82 | Exceptional 7.1% |
| Egyptians | 98.7 /100 | #83 | Exceptional 7.1% |
| Immigrants | Albania | 98.7 /100 | #84 | Exceptional 7.1% |