Immigrants from Mexico vs Sioux Female Disability
COMPARE
Immigrants from Mexico
Sioux
Female Disability
Female Disability Comparison
Immigrants from Mexico
Sioux
12.2%
FEMALE DISABILITY
50.8/ 100
METRIC RATING
173rd/ 347
METRIC RANK
12.9%
FEMALE DISABILITY
0.1/ 100
METRIC RATING
273rd/ 347
METRIC RANK
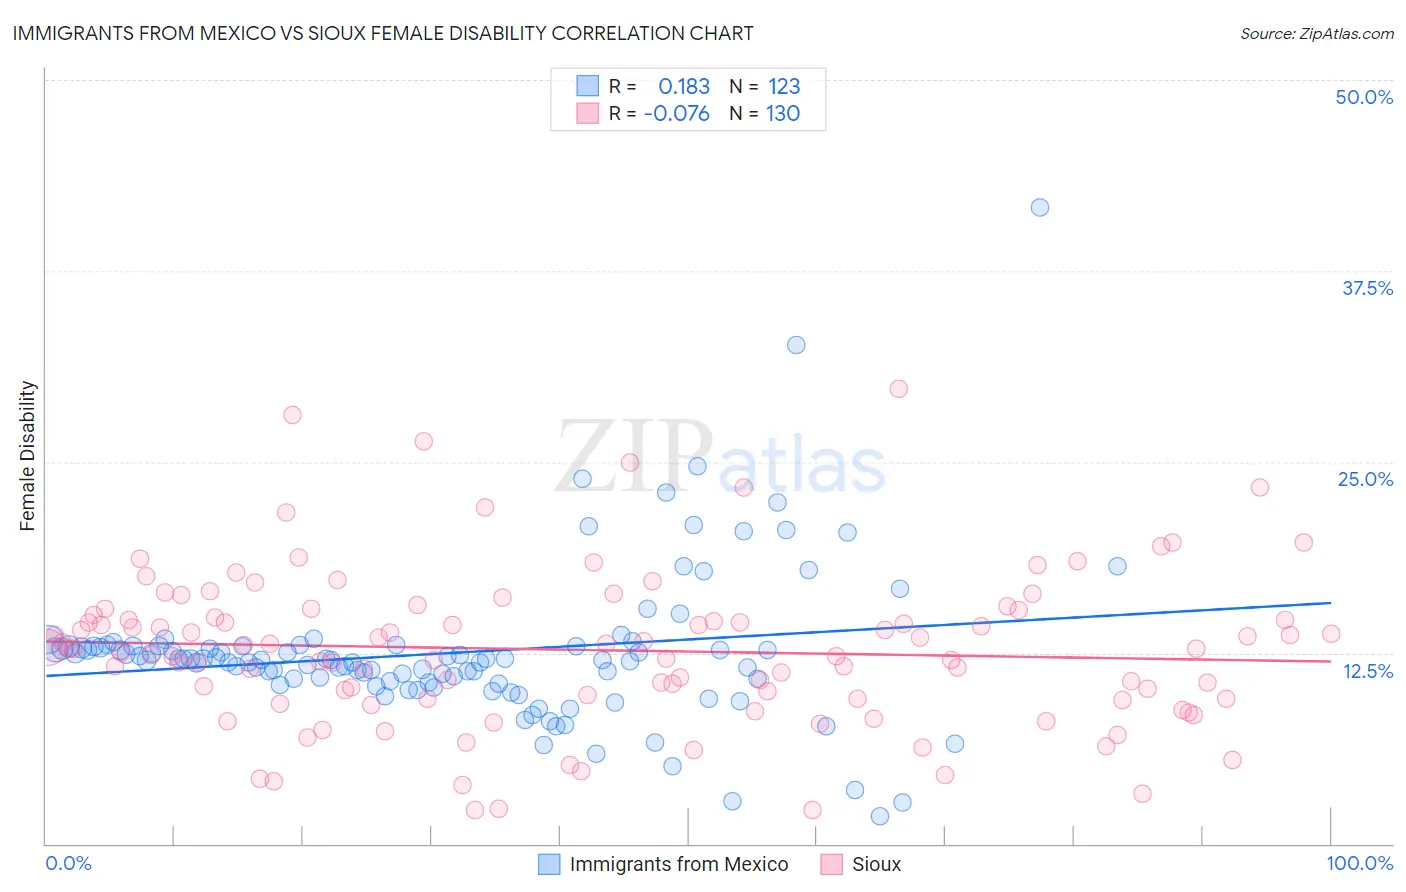
Immigrants from Mexico vs Sioux Female Disability Correlation Chart
The statistical analysis conducted on geographies consisting of 513,519,603 people shows a poor positive correlation between the proportion of Immigrants from Mexico and percentage of females with a disability in the United States with a correlation coefficient (R) of 0.183 and weighted average of 12.2%. Similarly, the statistical analysis conducted on geographies consisting of 234,143,610 people shows a slight negative correlation between the proportion of Sioux and percentage of females with a disability in the United States with a correlation coefficient (R) of -0.076 and weighted average of 12.9%, a difference of 6.2%.
Female Disability Correlation Summary
| Measurement | Immigrants from Mexico | Sioux |
| Minimum | 1.8% | 2.2% |
| Maximum | 41.7% | 29.8% |
| Range | 39.9% | 27.6% |
| Mean | 12.5% | 12.7% |
| Median | 12.1% | 12.7% |
| Interquartile 25% (IQ1) | 10.6% | 9.5% |
| Interquartile 75% (IQ3) | 12.9% | 15.0% |
| Interquartile Range (IQR) | 2.4% | 5.5% |
| Standard Deviation (Sample) | 5.0% | 5.1% |
| Standard Deviation (Population) | 5.0% | 5.1% |
Similar Demographics by Female Disability
Demographics Similar to Immigrants from Mexico by Female Disability
In terms of female disability, the demographic groups most similar to Immigrants from Mexico are Immigrants from England (12.2%, a difference of 0.030%), Haitian (12.2%, a difference of 0.040%), Immigrants from St. Vincent and the Grenadines (12.2%, a difference of 0.040%), Immigrants from Southern Europe (12.2%, a difference of 0.21%), and Maltese (12.2%, a difference of 0.23%).
| Demographics | Rating | Rank | Female Disability |
| Lithuanians | 59.5 /100 | #166 | Average 12.2% |
| Immigrants | Latin America | 59.0 /100 | #167 | Average 12.2% |
| Immigrants | Haiti | 58.8 /100 | #168 | Average 12.2% |
| Lebanese | 58.1 /100 | #169 | Average 12.2% |
| Maltese | 57.0 /100 | #170 | Average 12.2% |
| Immigrants | Southern Europe | 56.3 /100 | #171 | Average 12.2% |
| Haitians | 51.9 /100 | #172 | Average 12.2% |
| Immigrants | Mexico | 50.8 /100 | #173 | Average 12.2% |
| Immigrants | England | 50.0 /100 | #174 | Average 12.2% |
| Immigrants | St. Vincent and the Grenadines | 49.7 /100 | #175 | Average 12.2% |
| Immigrants | Guyana | 43.1 /100 | #176 | Average 12.2% |
| Immigrants | Ghana | 42.5 /100 | #177 | Average 12.2% |
| Immigrants | Western Europe | 40.9 /100 | #178 | Average 12.2% |
| Immigrants | Fiji | 38.2 /100 | #179 | Fair 12.3% |
| Albanians | 37.9 /100 | #180 | Fair 12.3% |
Demographics Similar to Sioux by Female Disability
In terms of female disability, the demographic groups most similar to Sioux are German (12.9%, a difference of 0.020%), Portuguese (13.0%, a difference of 0.12%), Cheyenne (13.0%, a difference of 0.17%), Immigrants from Dominica (13.0%, a difference of 0.22%), and Dutch (12.9%, a difference of 0.23%).
| Demographics | Rating | Rank | Female Disability |
| Finns | 0.4 /100 | #266 | Tragic 12.8% |
| Senegalese | 0.4 /100 | #267 | Tragic 12.8% |
| Immigrants | Laos | 0.4 /100 | #268 | Tragic 12.8% |
| Indonesians | 0.4 /100 | #269 | Tragic 12.8% |
| Immigrants | Liberia | 0.3 /100 | #270 | Tragic 12.9% |
| Dutch | 0.2 /100 | #271 | Tragic 12.9% |
| Germans | 0.1 /100 | #272 | Tragic 12.9% |
| Sioux | 0.1 /100 | #273 | Tragic 12.9% |
| Portuguese | 0.1 /100 | #274 | Tragic 13.0% |
| Cheyenne | 0.1 /100 | #275 | Tragic 13.0% |
| Immigrants | Dominica | 0.1 /100 | #276 | Tragic 13.0% |
| Spanish | 0.1 /100 | #277 | Tragic 13.0% |
| Scottish | 0.1 /100 | #278 | Tragic 13.0% |
| Arapaho | 0.1 /100 | #279 | Tragic 13.0% |
| Irish | 0.1 /100 | #280 | Tragic 13.1% |