Immigrants from North Macedonia vs Sioux Female Disability
COMPARE
Immigrants from North Macedonia
Sioux
Female Disability
Female Disability Comparison
Immigrants from North Macedonia
Sioux
11.8%
FEMALE DISABILITY
96.8/ 100
METRIC RATING
122nd/ 347
METRIC RANK
12.9%
FEMALE DISABILITY
0.1/ 100
METRIC RATING
273rd/ 347
METRIC RANK
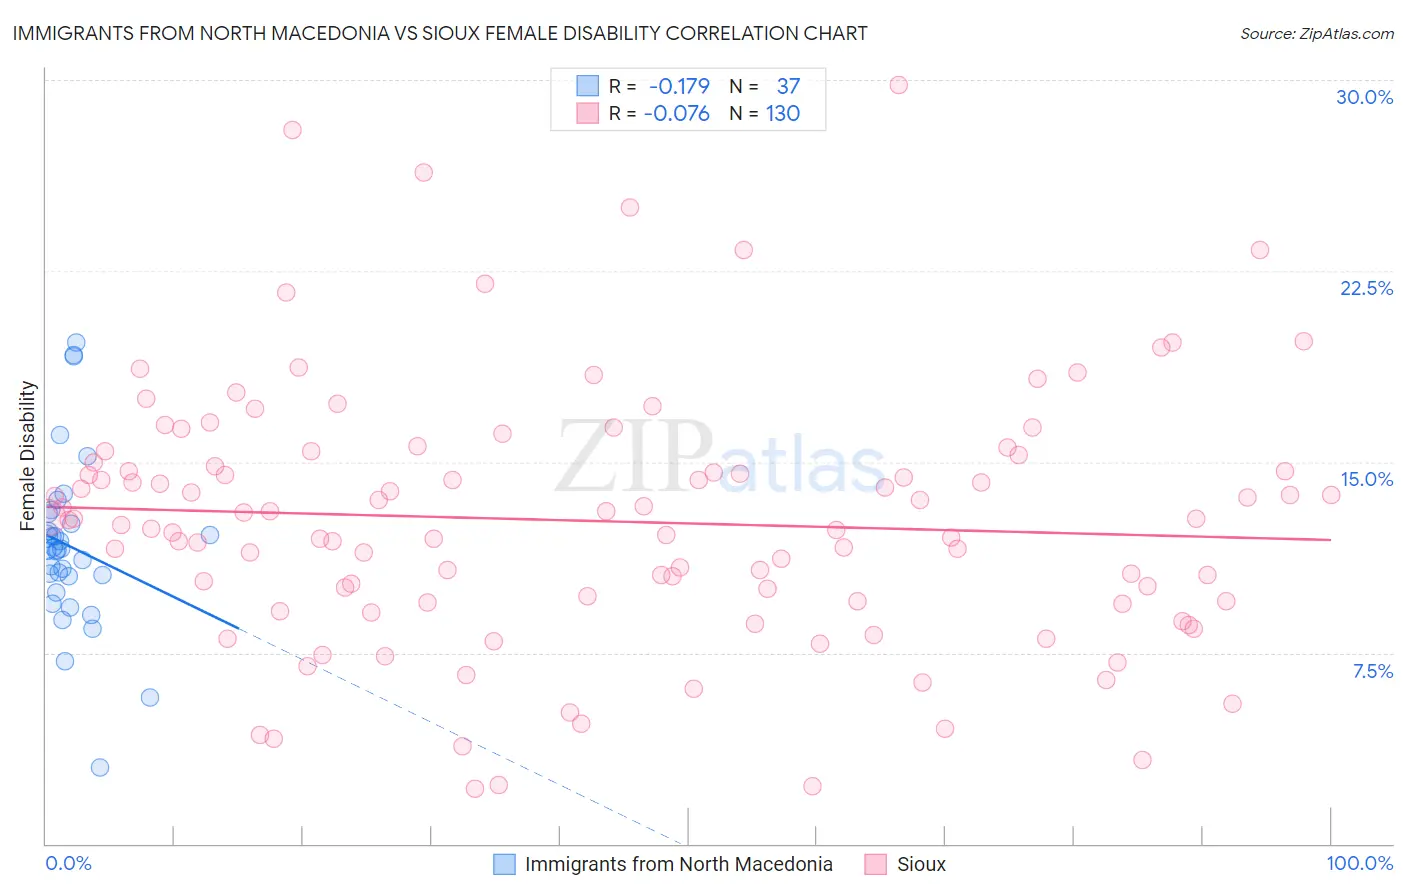
Immigrants from North Macedonia vs Sioux Female Disability Correlation Chart
The statistical analysis conducted on geographies consisting of 74,311,700 people shows a poor negative correlation between the proportion of Immigrants from North Macedonia and percentage of females with a disability in the United States with a correlation coefficient (R) of -0.179 and weighted average of 11.8%. Similarly, the statistical analysis conducted on geographies consisting of 234,143,610 people shows a slight negative correlation between the proportion of Sioux and percentage of females with a disability in the United States with a correlation coefficient (R) of -0.076 and weighted average of 12.9%, a difference of 9.7%.
Female Disability Correlation Summary
| Measurement | Immigrants from North Macedonia | Sioux |
| Minimum | 3.0% | 2.2% |
| Maximum | 19.7% | 29.8% |
| Range | 16.7% | 27.6% |
| Mean | 11.7% | 12.7% |
| Median | 11.6% | 12.7% |
| Interquartile 25% (IQ1) | 10.2% | 9.5% |
| Interquartile 75% (IQ3) | 12.8% | 15.0% |
| Interquartile Range (IQR) | 2.6% | 5.5% |
| Standard Deviation (Sample) | 3.3% | 5.1% |
| Standard Deviation (Population) | 3.3% | 5.1% |
Similar Demographics by Female Disability
Demographics Similar to Immigrants from North Macedonia by Female Disability
In terms of female disability, the demographic groups most similar to Immigrants from North Macedonia are Immigrants from Netherlands (11.8%, a difference of 0.010%), Immigrants from Kazakhstan (11.8%, a difference of 0.040%), Immigrants from Croatia (11.8%, a difference of 0.050%), Russian (11.8%, a difference of 0.10%), and Immigrants from Eastern Europe (11.8%, a difference of 0.12%).
| Demographics | Rating | Rank | Female Disability |
| Brazilians | 97.7 /100 | #115 | Exceptional 11.8% |
| Immigrants | Morocco | 97.6 /100 | #116 | Exceptional 11.8% |
| Immigrants | Eastern Europe | 97.2 /100 | #117 | Exceptional 11.8% |
| Immigrants | Nigeria | 97.2 /100 | #118 | Exceptional 11.8% |
| Immigrants | Uganda | 97.2 /100 | #119 | Exceptional 11.8% |
| Immigrants | Kazakhstan | 97.0 /100 | #120 | Exceptional 11.8% |
| Immigrants | Netherlands | 96.9 /100 | #121 | Exceptional 11.8% |
| Immigrants | North Macedonia | 96.8 /100 | #122 | Exceptional 11.8% |
| Immigrants | Croatia | 96.7 /100 | #123 | Exceptional 11.8% |
| Russians | 96.5 /100 | #124 | Exceptional 11.8% |
| Immigrants | Italy | 96.4 /100 | #125 | Exceptional 11.8% |
| Immigrants | Europe | 96.2 /100 | #126 | Exceptional 11.8% |
| South American Indians | 95.8 /100 | #127 | Exceptional 11.8% |
| Immigrants | Latvia | 95.6 /100 | #128 | Exceptional 11.8% |
| Macedonians | 95.5 /100 | #129 | Exceptional 11.8% |
Demographics Similar to Sioux by Female Disability
In terms of female disability, the demographic groups most similar to Sioux are German (12.9%, a difference of 0.020%), Portuguese (13.0%, a difference of 0.12%), Cheyenne (13.0%, a difference of 0.17%), Immigrants from Dominica (13.0%, a difference of 0.22%), and Dutch (12.9%, a difference of 0.23%).
| Demographics | Rating | Rank | Female Disability |
| Finns | 0.4 /100 | #266 | Tragic 12.8% |
| Senegalese | 0.4 /100 | #267 | Tragic 12.8% |
| Immigrants | Laos | 0.4 /100 | #268 | Tragic 12.8% |
| Indonesians | 0.4 /100 | #269 | Tragic 12.8% |
| Immigrants | Liberia | 0.3 /100 | #270 | Tragic 12.9% |
| Dutch | 0.2 /100 | #271 | Tragic 12.9% |
| Germans | 0.1 /100 | #272 | Tragic 12.9% |
| Sioux | 0.1 /100 | #273 | Tragic 12.9% |
| Portuguese | 0.1 /100 | #274 | Tragic 13.0% |
| Cheyenne | 0.1 /100 | #275 | Tragic 13.0% |
| Immigrants | Dominica | 0.1 /100 | #276 | Tragic 13.0% |
| Spanish | 0.1 /100 | #277 | Tragic 13.0% |
| Scottish | 0.1 /100 | #278 | Tragic 13.0% |
| Arapaho | 0.1 /100 | #279 | Tragic 13.0% |
| Irish | 0.1 /100 | #280 | Tragic 13.1% |