Alaska Native vs Osage Vision Disability
COMPARE
Alaska Native
Osage
Vision Disability
Vision Disability Comparison
Alaska Natives
Osage
2.7%
VISION DISABILITY
0.0/ 100
METRIC RATING
318th/ 347
METRIC RANK
2.7%
VISION DISABILITY
0.0/ 100
METRIC RATING
315th/ 347
METRIC RANK
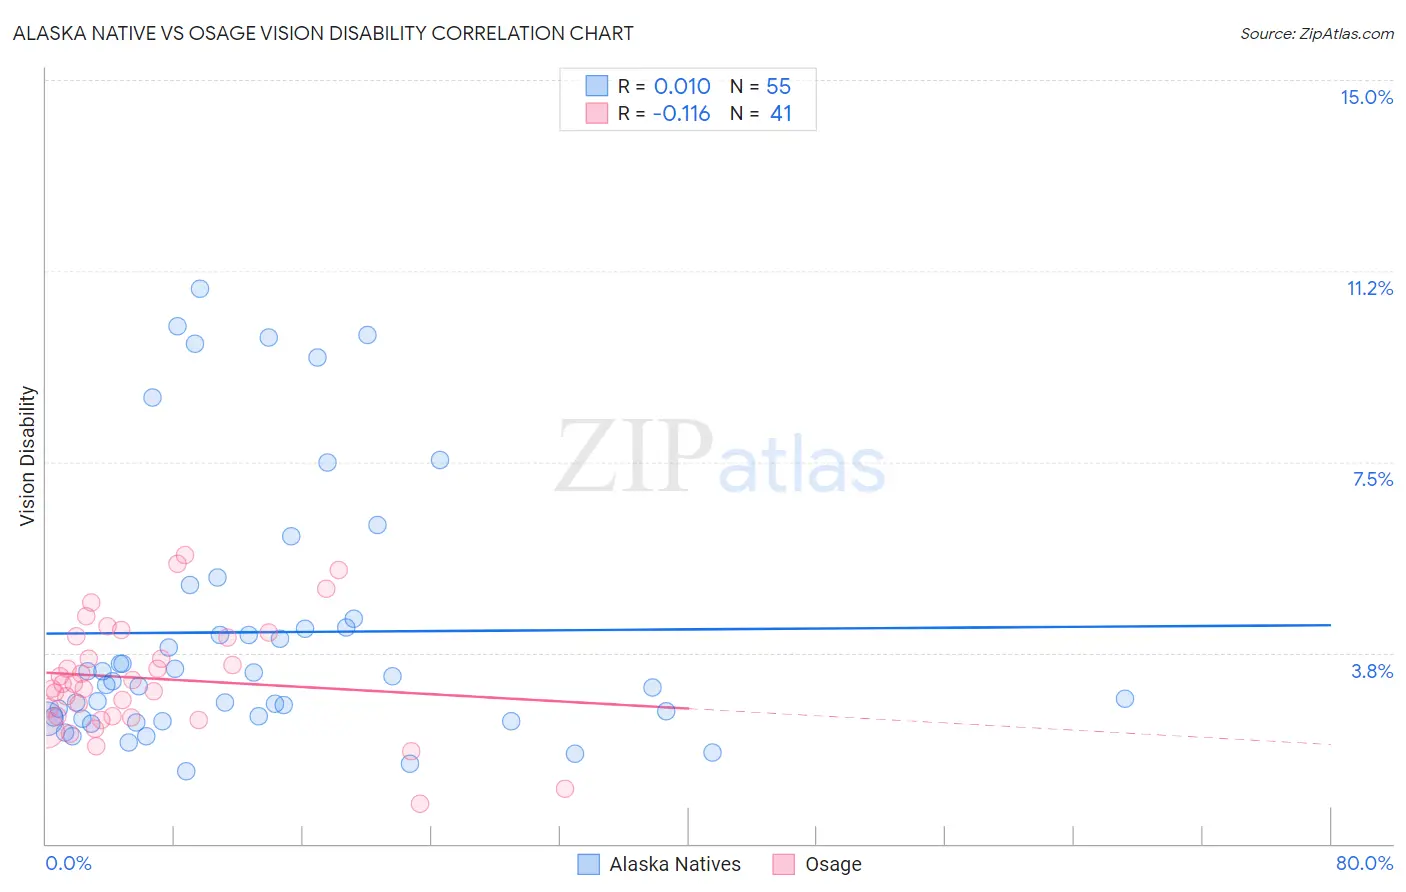
Alaska Native vs Osage Vision Disability Correlation Chart
The statistical analysis conducted on geographies consisting of 76,749,466 people shows no correlation between the proportion of Alaska Natives and percentage of population with vision disability in the United States with a correlation coefficient (R) of 0.010 and weighted average of 2.7%. Similarly, the statistical analysis conducted on geographies consisting of 91,791,636 people shows a poor negative correlation between the proportion of Osage and percentage of population with vision disability in the United States with a correlation coefficient (R) of -0.116 and weighted average of 2.7%, a difference of 1.8%.
Vision Disability Correlation Summary
| Measurement | Alaska Native | Osage |
| Minimum | 1.4% | 0.78% |
| Maximum | 10.9% | 5.7% |
| Range | 9.5% | 4.9% |
| Mean | 4.2% | 3.2% |
| Median | 3.2% | 3.1% |
| Interquartile 25% (IQ1) | 2.5% | 2.5% |
| Interquartile 75% (IQ3) | 4.4% | 4.1% |
| Interquartile Range (IQR) | 1.9% | 1.6% |
| Standard Deviation (Sample) | 2.6% | 1.1% |
| Standard Deviation (Population) | 2.5% | 1.1% |
Demographics Similar to Alaska Natives and Osage by Vision Disability
In terms of vision disability, the demographic groups most similar to Alaska Natives are Yup'ik (2.7%, a difference of 1.1%), Shoshone (2.7%, a difference of 1.3%), Tohono O'odham (2.8%, a difference of 1.4%), Black/African American (2.8%, a difference of 2.1%), and Inupiat (2.7%, a difference of 3.0%). Similarly, the demographic groups most similar to Osage are Shoshone (2.7%, a difference of 0.43%), Yup'ik (2.7%, a difference of 0.63%), Inupiat (2.7%, a difference of 1.2%), Potawatomi (2.6%, a difference of 1.3%), and American (2.6%, a difference of 1.3%).
| Demographics | Rating | Rank | Vision Disability |
| Iroquois | 0.0 /100 | #306 | Tragic 2.6% |
| Immigrants | Dominican Republic | 0.0 /100 | #307 | Tragic 2.6% |
| Arapaho | 0.0 /100 | #308 | Tragic 2.6% |
| Immigrants | Yemen | 0.0 /100 | #309 | Tragic 2.6% |
| Blackfeet | 0.0 /100 | #310 | Tragic 2.6% |
| Dominicans | 0.0 /100 | #311 | Tragic 2.6% |
| Americans | 0.0 /100 | #312 | Tragic 2.6% |
| Potawatomi | 0.0 /100 | #313 | Tragic 2.6% |
| Inupiat | 0.0 /100 | #314 | Tragic 2.7% |
| Osage | 0.0 /100 | #315 | Tragic 2.7% |
| Shoshone | 0.0 /100 | #316 | Tragic 2.7% |
| Yup'ik | 0.0 /100 | #317 | Tragic 2.7% |
| Alaska Natives | 0.0 /100 | #318 | Tragic 2.7% |
| Tohono O'odham | 0.0 /100 | #319 | Tragic 2.8% |
| Blacks/African Americans | 0.0 /100 | #320 | Tragic 2.8% |
| Comanche | 0.0 /100 | #321 | Tragic 2.8% |
| Paiute | 0.0 /100 | #322 | Tragic 2.9% |
| Tlingit-Haida | 0.0 /100 | #323 | Tragic 2.9% |
| Hopi | 0.0 /100 | #324 | Tragic 2.9% |
| Cherokee | 0.0 /100 | #325 | Tragic 2.9% |
| Spanish Americans | 0.0 /100 | #326 | Tragic 2.9% |