Alaska Native vs European Vision Disability
COMPARE
Alaska Native
European
Vision Disability
Vision Disability Comparison
Alaska Natives
Europeans
2.7%
VISION DISABILITY
0.0/ 100
METRIC RATING
318th/ 347
METRIC RANK
2.2%
VISION DISABILITY
25.7/ 100
METRIC RATING
192nd/ 347
METRIC RANK
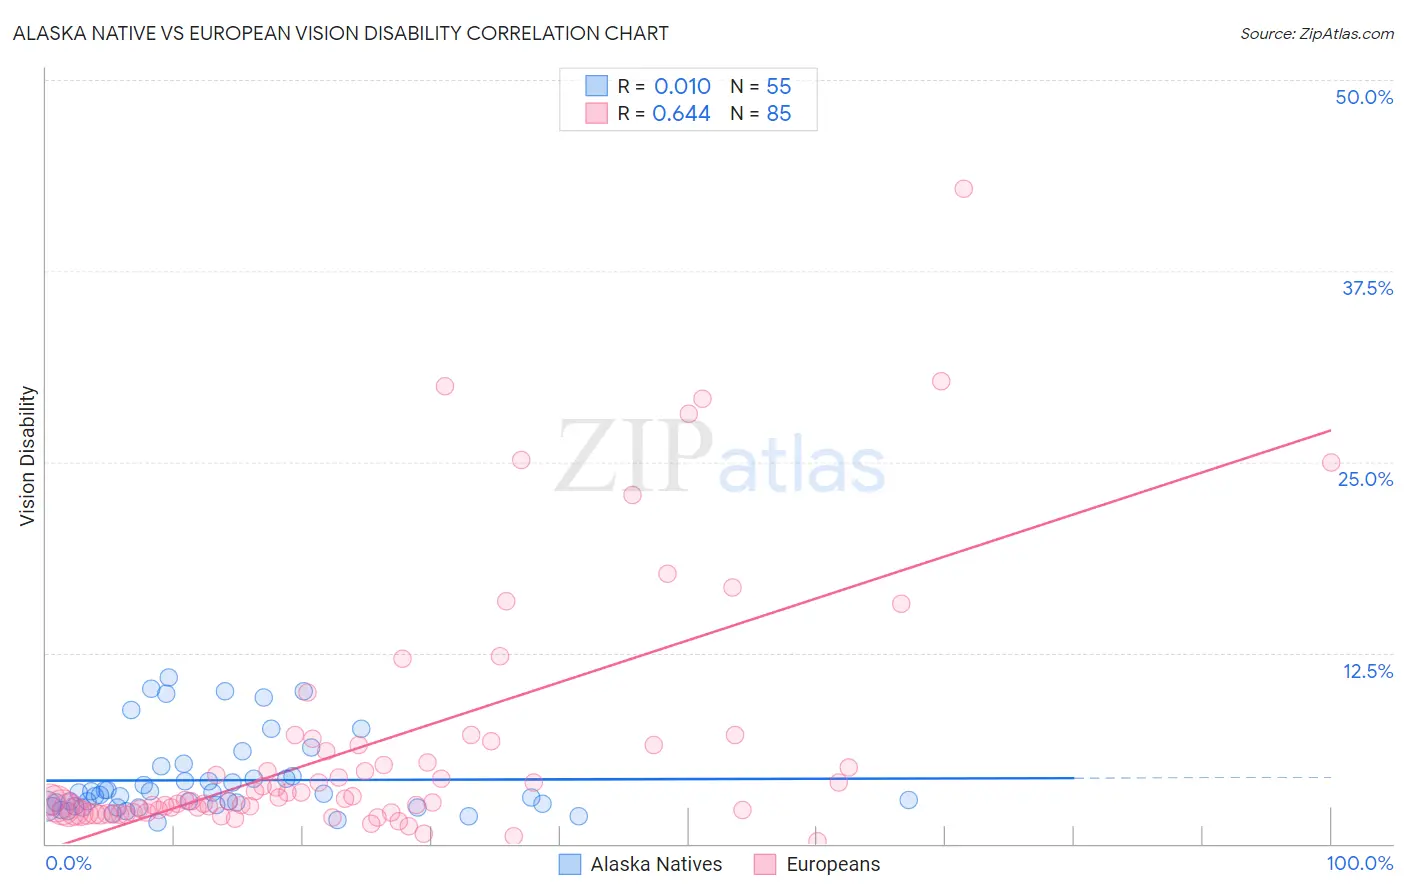
Alaska Native vs European Vision Disability Correlation Chart
The statistical analysis conducted on geographies consisting of 76,749,466 people shows no correlation between the proportion of Alaska Natives and percentage of population with vision disability in the United States with a correlation coefficient (R) of 0.010 and weighted average of 2.7%. Similarly, the statistical analysis conducted on geographies consisting of 560,182,273 people shows a significant positive correlation between the proportion of Europeans and percentage of population with vision disability in the United States with a correlation coefficient (R) of 0.644 and weighted average of 2.2%, a difference of 23.9%.
Vision Disability Correlation Summary
| Measurement | Alaska Native | European |
| Minimum | 1.4% | 0.14% |
| Maximum | 10.9% | 42.9% |
| Range | 9.5% | 42.7% |
| Mean | 4.2% | 6.5% |
| Median | 3.2% | 2.9% |
| Interquartile 25% (IQ1) | 2.5% | 2.1% |
| Interquartile 75% (IQ3) | 4.4% | 6.5% |
| Interquartile Range (IQR) | 1.9% | 4.4% |
| Standard Deviation (Sample) | 2.6% | 8.3% |
| Standard Deviation (Population) | 2.5% | 8.3% |
Similar Demographics by Vision Disability
Demographics Similar to Alaska Natives by Vision Disability
In terms of vision disability, the demographic groups most similar to Alaska Natives are Yup'ik (2.7%, a difference of 1.1%), Shoshone (2.7%, a difference of 1.3%), Tohono O'odham (2.8%, a difference of 1.4%), Osage (2.7%, a difference of 1.8%), and Black/African American (2.8%, a difference of 2.1%).
| Demographics | Rating | Rank | Vision Disability |
| Dominicans | 0.0 /100 | #311 | Tragic 2.6% |
| Americans | 0.0 /100 | #312 | Tragic 2.6% |
| Potawatomi | 0.0 /100 | #313 | Tragic 2.6% |
| Inupiat | 0.0 /100 | #314 | Tragic 2.7% |
| Osage | 0.0 /100 | #315 | Tragic 2.7% |
| Shoshone | 0.0 /100 | #316 | Tragic 2.7% |
| Yup'ik | 0.0 /100 | #317 | Tragic 2.7% |
| Alaska Natives | 0.0 /100 | #318 | Tragic 2.7% |
| Tohono O'odham | 0.0 /100 | #319 | Tragic 2.8% |
| Blacks/African Americans | 0.0 /100 | #320 | Tragic 2.8% |
| Comanche | 0.0 /100 | #321 | Tragic 2.8% |
| Paiute | 0.0 /100 | #322 | Tragic 2.9% |
| Tlingit-Haida | 0.0 /100 | #323 | Tragic 2.9% |
| Hopi | 0.0 /100 | #324 | Tragic 2.9% |
| Cherokee | 0.0 /100 | #325 | Tragic 2.9% |
Demographics Similar to Europeans by Vision Disability
In terms of vision disability, the demographic groups most similar to Europeans are Canadian (2.2%, a difference of 0.010%), Immigrants from Costa Rica (2.2%, a difference of 0.030%), British (2.2%, a difference of 0.050%), Salvadoran (2.2%, a difference of 0.13%), and Immigrants from Barbados (2.2%, a difference of 0.15%).
| Demographics | Rating | Rank | Vision Disability |
| Immigrants | Middle Africa | 33.5 /100 | #185 | Fair 2.2% |
| Native Hawaiians | 33.3 /100 | #186 | Fair 2.2% |
| Immigrants | St. Vincent and the Grenadines | 30.3 /100 | #187 | Fair 2.2% |
| Guyanese | 28.9 /100 | #188 | Fair 2.2% |
| Salvadorans | 27.4 /100 | #189 | Fair 2.2% |
| Immigrants | Costa Rica | 26.1 /100 | #190 | Fair 2.2% |
| Canadians | 25.8 /100 | #191 | Fair 2.2% |
| Europeans | 25.7 /100 | #192 | Fair 2.2% |
| British | 25.1 /100 | #193 | Fair 2.2% |
| Immigrants | Barbados | 24.0 /100 | #194 | Fair 2.2% |
| Immigrants | Immigrants | 23.7 /100 | #195 | Fair 2.2% |
| Immigrants | Grenada | 23.1 /100 | #196 | Fair 2.2% |
| Ghanaians | 21.8 /100 | #197 | Fair 2.2% |
| Czechoslovakians | 21.6 /100 | #198 | Fair 2.2% |
| Immigrants | El Salvador | 21.0 /100 | #199 | Fair 2.2% |