Ghanaian vs Immigrants from Belgium Female Disability
COMPARE
Ghanaian
Immigrants from Belgium
Female Disability
Female Disability Comparison
Ghanaians
Immigrants from Belgium
12.1%
FEMALE DISABILITY
76.6/ 100
METRIC RATING
155th/ 347
METRIC RANK
11.3%
FEMALE DISABILITY
100.0/ 100
METRIC RATING
51st/ 347
METRIC RANK
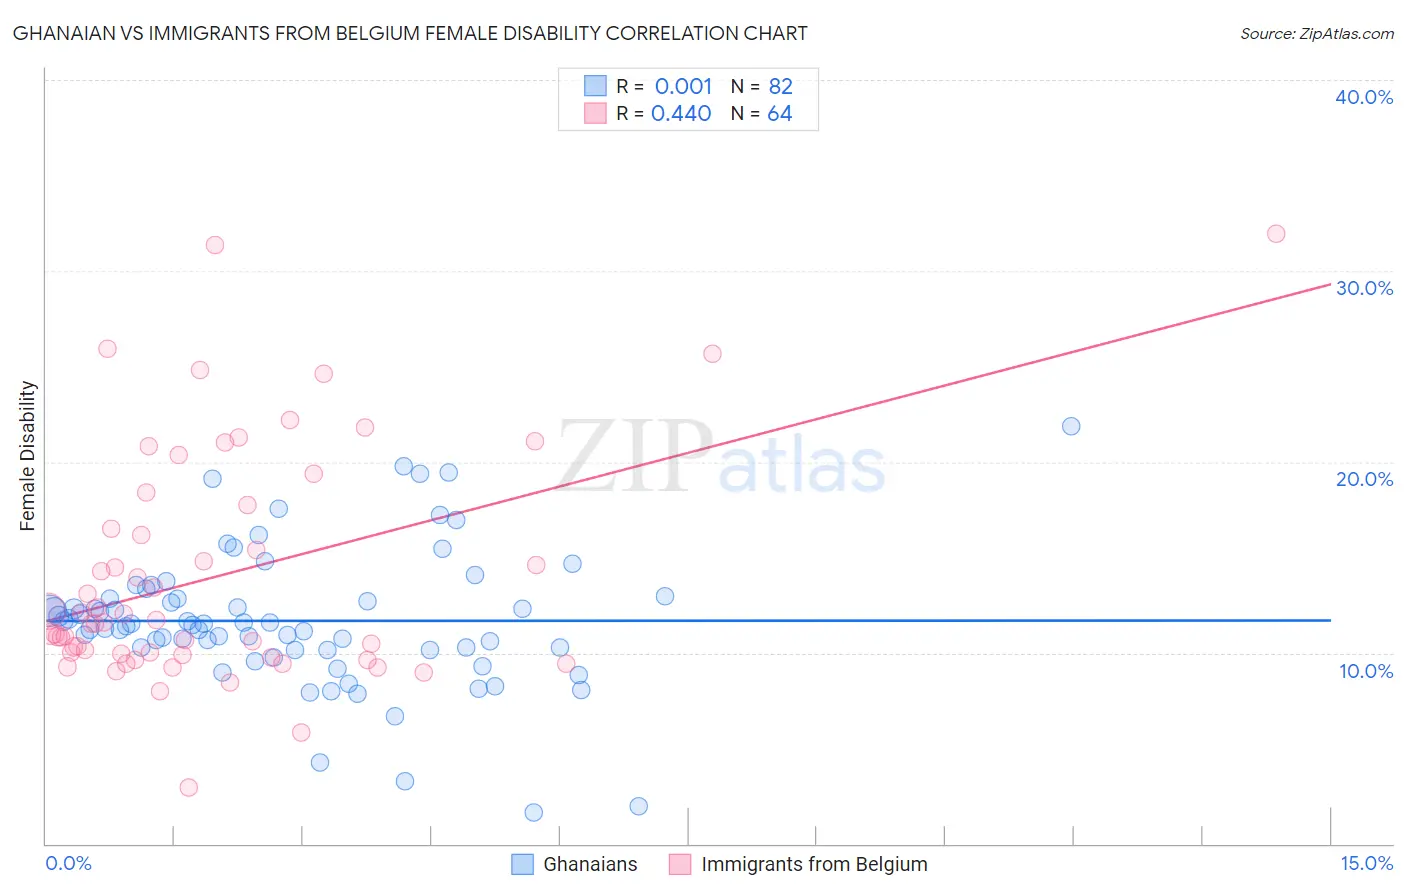
Ghanaian vs Immigrants from Belgium Female Disability Correlation Chart
The statistical analysis conducted on geographies consisting of 190,696,570 people shows no correlation between the proportion of Ghanaians and percentage of females with a disability in the United States with a correlation coefficient (R) of 0.001 and weighted average of 12.1%. Similarly, the statistical analysis conducted on geographies consisting of 146,716,941 people shows a moderate positive correlation between the proportion of Immigrants from Belgium and percentage of females with a disability in the United States with a correlation coefficient (R) of 0.440 and weighted average of 11.3%, a difference of 6.6%.
Female Disability Correlation Summary
| Measurement | Ghanaian | Immigrants from Belgium |
| Minimum | 1.6% | 2.9% |
| Maximum | 21.9% | 31.9% |
| Range | 20.2% | 29.0% |
| Mean | 11.7% | 14.0% |
| Median | 11.5% | 11.5% |
| Interquartile 25% (IQ1) | 10.2% | 9.9% |
| Interquartile 75% (IQ3) | 12.9% | 17.1% |
| Interquartile Range (IQR) | 2.7% | 7.2% |
| Standard Deviation (Sample) | 3.6% | 6.0% |
| Standard Deviation (Population) | 3.6% | 6.0% |
Similar Demographics by Female Disability
Demographics Similar to Ghanaians by Female Disability
In terms of female disability, the demographic groups most similar to Ghanaians are Syrian (12.1%, a difference of 0.020%), Sudanese (12.0%, a difference of 0.14%), Immigrants from Scotland (12.0%, a difference of 0.15%), Moroccan (12.1%, a difference of 0.19%), and Danish (12.1%, a difference of 0.20%).
| Demographics | Rating | Rank | Female Disability |
| Immigrants | Kenya | 83.1 /100 | #148 | Excellent 12.0% |
| Greeks | 82.0 /100 | #149 | Excellent 12.0% |
| Immigrants | Moldova | 81.4 /100 | #150 | Excellent 12.0% |
| Icelanders | 80.7 /100 | #151 | Excellent 12.0% |
| Immigrants | Scotland | 79.3 /100 | #152 | Good 12.0% |
| Sudanese | 79.1 /100 | #153 | Good 12.0% |
| Syrians | 76.9 /100 | #154 | Good 12.1% |
| Ghanaians | 76.6 /100 | #155 | Good 12.1% |
| Moroccans | 72.9 /100 | #156 | Good 12.1% |
| Danes | 72.5 /100 | #157 | Good 12.1% |
| Immigrants | Middle Africa | 72.4 /100 | #158 | Good 12.1% |
| Immigrants | Central America | 67.7 /100 | #159 | Good 12.1% |
| Immigrants | Guatemala | 66.0 /100 | #160 | Good 12.1% |
| Guyanese | 64.7 /100 | #161 | Good 12.1% |
| Immigrants | Ukraine | 64.3 /100 | #162 | Good 12.1% |
Demographics Similar to Immigrants from Belgium by Female Disability
In terms of female disability, the demographic groups most similar to Immigrants from Belgium are Inupiat (11.3%, a difference of 0.080%), Immigrants from Peru (11.3%, a difference of 0.12%), Immigrants from Saudi Arabia (11.3%, a difference of 0.16%), Peruvian (11.3%, a difference of 0.22%), and Bulgarian (11.3%, a difference of 0.24%).
| Demographics | Rating | Rank | Female Disability |
| Cambodians | 100.0 /100 | #44 | Exceptional 11.3% |
| Immigrants | Sweden | 100.0 /100 | #45 | Exceptional 11.3% |
| Immigrants | Nepal | 100.0 /100 | #46 | Exceptional 11.3% |
| Jordanians | 100.0 /100 | #47 | Exceptional 11.3% |
| Zimbabweans | 100.0 /100 | #48 | Exceptional 11.3% |
| Tongans | 100.0 /100 | #49 | Exceptional 11.3% |
| Inupiat | 100.0 /100 | #50 | Exceptional 11.3% |
| Immigrants | Belgium | 100.0 /100 | #51 | Exceptional 11.3% |
| Immigrants | Peru | 99.9 /100 | #52 | Exceptional 11.3% |
| Immigrants | Saudi Arabia | 99.9 /100 | #53 | Exceptional 11.3% |
| Peruvians | 99.9 /100 | #54 | Exceptional 11.3% |
| Bulgarians | 99.9 /100 | #55 | Exceptional 11.3% |
| Taiwanese | 99.9 /100 | #56 | Exceptional 11.4% |
| South Americans | 99.9 /100 | #57 | Exceptional 11.4% |
| Laotians | 99.9 /100 | #58 | Exceptional 11.4% |