Alaska Native vs Immigrants from Belgium Unemployment Among Ages 55 to 59 years
COMPARE
Alaska Native
Immigrants from Belgium
Unemployment Among Ages 55 to 59 years
Unemployment Among Ages 55 to 59 years Comparison
Alaska Natives
Immigrants from Belgium
6.2%
UNEMPLOYMENT AMONG AGES 55 TO 59 YEARS
0.0/ 100
METRIC RATING
330th/ 347
METRIC RANK
4.7%
UNEMPLOYMENT AMONG AGES 55 TO 59 YEARS
95.0/ 100
METRIC RATING
96th/ 347
METRIC RANK
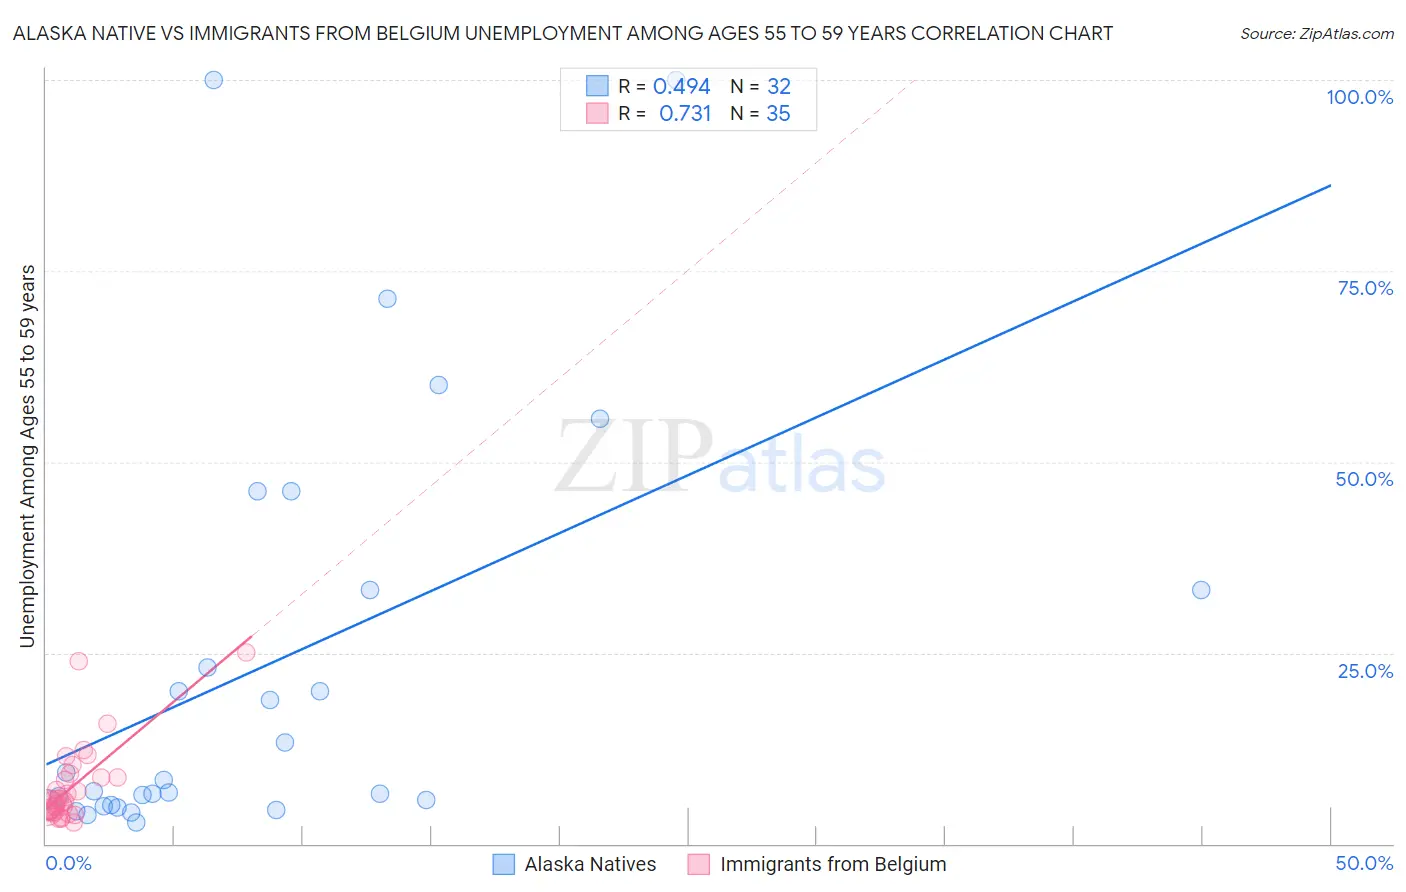
Alaska Native vs Immigrants from Belgium Unemployment Among Ages 55 to 59 years Correlation Chart
The statistical analysis conducted on geographies consisting of 74,675,263 people shows a moderate positive correlation between the proportion of Alaska Natives and unemployment rate among population between the ages 55 and 59 in the United States with a correlation coefficient (R) of 0.494 and weighted average of 6.2%. Similarly, the statistical analysis conducted on geographies consisting of 142,844,772 people shows a strong positive correlation between the proportion of Immigrants from Belgium and unemployment rate among population between the ages 55 and 59 in the United States with a correlation coefficient (R) of 0.731 and weighted average of 4.7%, a difference of 33.6%.
Unemployment Among Ages 55 to 59 years Correlation Summary
| Measurement | Alaska Native | Immigrants from Belgium |
| Minimum | 2.8% | 2.8% |
| Maximum | 100.0% | 25.0% |
| Range | 97.2% | 22.2% |
| Mean | 23.2% | 7.4% |
| Median | 7.6% | 5.5% |
| Interquartile 25% (IQ1) | 5.0% | 4.3% |
| Interquartile 75% (IQ3) | 33.3% | 8.6% |
| Interquartile Range (IQR) | 28.3% | 4.3% |
| Standard Deviation (Sample) | 27.5% | 5.2% |
| Standard Deviation (Population) | 27.1% | 5.1% |
Similar Demographics by Unemployment Among Ages 55 to 59 years
Demographics Similar to Alaska Natives by Unemployment Among Ages 55 to 59 years
In terms of unemployment among ages 55 to 59 years, the demographic groups most similar to Alaska Natives are Dominican (6.2%, a difference of 0.43%), Immigrants from Dominican Republic (6.3%, a difference of 0.68%), Yuman (6.1%, a difference of 1.9%), Arapaho (6.1%, a difference of 3.1%), and Aleut (6.4%, a difference of 3.1%).
| Demographics | Rating | Rank | Unemployment Among Ages 55 to 59 years |
| Immigrants | Bangladesh | 0.0 /100 | #323 | Tragic 5.9% |
| Vietnamese | 0.0 /100 | #324 | Tragic 5.9% |
| Immigrants | Armenia | 0.0 /100 | #325 | Tragic 6.0% |
| Natives/Alaskans | 0.0 /100 | #326 | Tragic 6.0% |
| Arapaho | 0.0 /100 | #327 | Tragic 6.1% |
| Yuman | 0.0 /100 | #328 | Tragic 6.1% |
| Dominicans | 0.0 /100 | #329 | Tragic 6.2% |
| Alaska Natives | 0.0 /100 | #330 | Tragic 6.2% |
| Immigrants | Dominican Republic | 0.0 /100 | #331 | Tragic 6.3% |
| Aleuts | 0.0 /100 | #332 | Tragic 6.4% |
| Pima | 0.0 /100 | #333 | Tragic 6.6% |
| Pueblo | 0.0 /100 | #334 | Tragic 6.7% |
| Colville | 0.0 /100 | #335 | Tragic 6.7% |
| Navajo | 0.0 /100 | #336 | Tragic 6.7% |
| Paiute | 0.0 /100 | #337 | Tragic 6.8% |
Demographics Similar to Immigrants from Belgium by Unemployment Among Ages 55 to 59 years
In terms of unemployment among ages 55 to 59 years, the demographic groups most similar to Immigrants from Belgium are Immigrants from Canada (4.7%, a difference of 0.010%), Immigrants from Germany (4.7%, a difference of 0.030%), Yugoslavian (4.7%, a difference of 0.050%), Serbian (4.7%, a difference of 0.12%), and Celtic (4.7%, a difference of 0.13%).
| Demographics | Rating | Rank | Unemployment Among Ages 55 to 59 years |
| Irish | 96.8 /100 | #89 | Exceptional 4.7% |
| Immigrants | Poland | 96.4 /100 | #90 | Exceptional 4.7% |
| New Zealanders | 96.3 /100 | #91 | Exceptional 4.7% |
| Iraqis | 96.1 /100 | #92 | Exceptional 4.7% |
| Immigrants | England | 95.8 /100 | #93 | Exceptional 4.7% |
| Immigrants | Scotland | 95.7 /100 | #94 | Exceptional 4.7% |
| South Africans | 95.6 /100 | #95 | Exceptional 4.7% |
| Immigrants | Belgium | 95.0 /100 | #96 | Exceptional 4.7% |
| Immigrants | Canada | 94.9 /100 | #97 | Exceptional 4.7% |
| Immigrants | Germany | 94.8 /100 | #98 | Exceptional 4.7% |
| Yugoslavians | 94.7 /100 | #99 | Exceptional 4.7% |
| Serbians | 94.4 /100 | #100 | Exceptional 4.7% |
| Celtics | 94.3 /100 | #101 | Exceptional 4.7% |
| Canadians | 94.1 /100 | #102 | Exceptional 4.7% |
| Immigrants | Oceania | 94.0 /100 | #103 | Exceptional 4.7% |