Alaska Native vs Icelander Disability Age 5 to 17
COMPARE
Alaska Native
Icelander
Disability Age 5 to 17
Disability Age 5 to 17 Comparison
Alaska Natives
Icelanders
6.0%
DISABILITY AGE 5 TO 17
0.2/ 100
METRIC RATING
273rd/ 347
METRIC RANK
5.7%
DISABILITY AGE 5 TO 17
14.6/ 100
METRIC RATING
200th/ 347
METRIC RANK
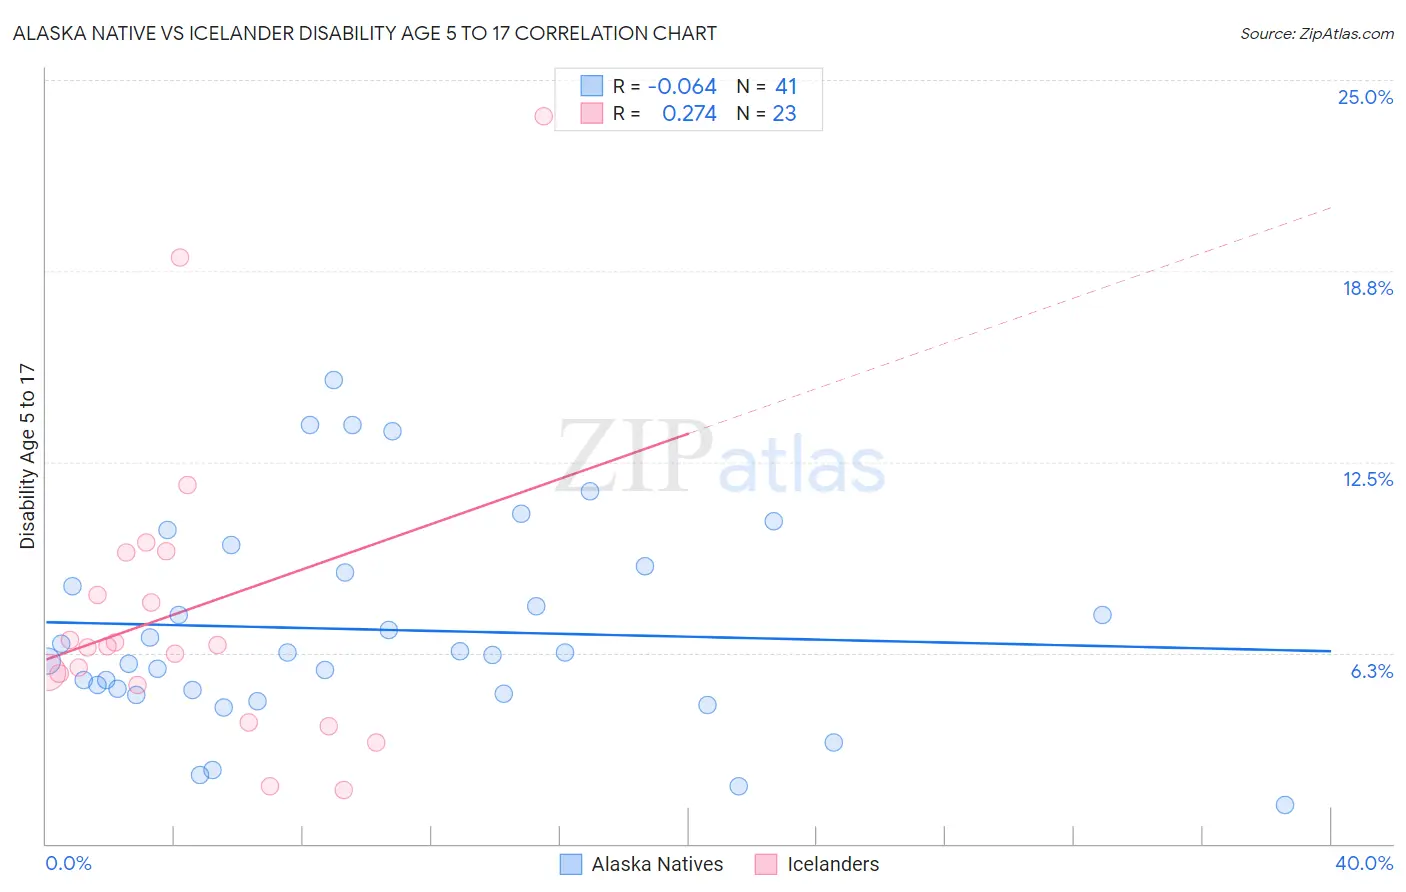
Alaska Native vs Icelander Disability Age 5 to 17 Correlation Chart
The statistical analysis conducted on geographies consisting of 76,612,507 people shows a slight negative correlation between the proportion of Alaska Natives and percentage of population with a disability between the ages 5 and 17 in the United States with a correlation coefficient (R) of -0.064 and weighted average of 6.0%. Similarly, the statistical analysis conducted on geographies consisting of 158,852,183 people shows a weak positive correlation between the proportion of Icelanders and percentage of population with a disability between the ages 5 and 17 in the United States with a correlation coefficient (R) of 0.274 and weighted average of 5.7%, a difference of 5.4%.
Disability Age 5 to 17 Correlation Summary
| Measurement | Alaska Native | Icelander |
| Minimum | 1.3% | 1.8% |
| Maximum | 15.2% | 23.8% |
| Range | 13.9% | 22.0% |
| Mean | 7.0% | 7.6% |
| Median | 6.2% | 6.5% |
| Interquartile 25% (IQ1) | 5.0% | 5.2% |
| Interquartile 75% (IQ3) | 9.0% | 9.5% |
| Interquartile Range (IQR) | 4.0% | 4.3% |
| Standard Deviation (Sample) | 3.3% | 5.1% |
| Standard Deviation (Population) | 3.3% | 5.0% |
Similar Demographics by Disability Age 5 to 17
Demographics Similar to Alaska Natives by Disability Age 5 to 17
In terms of disability age 5 to 17, the demographic groups most similar to Alaska Natives are Finnish (6.0%, a difference of 0.050%), Immigrants from Zaire (6.0%, a difference of 0.080%), Cheyenne (6.0%, a difference of 0.11%), Dutch (6.0%, a difference of 0.22%), and Japanese (6.1%, a difference of 0.33%).
| Demographics | Rating | Rank | Disability Age 5 to 17 |
| Slovenes | 0.6 /100 | #266 | Tragic 6.0% |
| Spanish | 0.5 /100 | #267 | Tragic 6.0% |
| Sioux | 0.4 /100 | #268 | Tragic 6.0% |
| Liberians | 0.4 /100 | #269 | Tragic 6.0% |
| Immigrants | Somalia | 0.4 /100 | #270 | Tragic 6.0% |
| Immigrants | Zaire | 0.2 /100 | #271 | Tragic 6.0% |
| Finns | 0.2 /100 | #272 | Tragic 6.0% |
| Alaska Natives | 0.2 /100 | #273 | Tragic 6.0% |
| Cheyenne | 0.2 /100 | #274 | Tragic 6.0% |
| Dutch | 0.2 /100 | #275 | Tragic 6.0% |
| Japanese | 0.1 /100 | #276 | Tragic 6.1% |
| Puget Sound Salish | 0.1 /100 | #277 | Tragic 6.1% |
| Immigrants | Liberia | 0.1 /100 | #278 | Tragic 6.1% |
| Immigrants | Jamaica | 0.1 /100 | #279 | Tragic 6.1% |
| Portuguese | 0.1 /100 | #280 | Tragic 6.1% |
Demographics Similar to Icelanders by Disability Age 5 to 17
In terms of disability age 5 to 17, the demographic groups most similar to Icelanders are Northern European (5.7%, a difference of 0.060%), Basque (5.7%, a difference of 0.090%), Austrian (5.7%, a difference of 0.14%), Spanish American Indian (5.7%, a difference of 0.18%), and Paiute (5.7%, a difference of 0.36%).
| Demographics | Rating | Rank | Disability Age 5 to 17 |
| Immigrants | Canada | 26.1 /100 | #193 | Fair 5.7% |
| Croatians | 23.6 /100 | #194 | Fair 5.7% |
| Immigrants | Nigeria | 23.4 /100 | #195 | Fair 5.7% |
| Inupiat | 23.3 /100 | #196 | Fair 5.7% |
| Immigrants | North America | 23.1 /100 | #197 | Fair 5.7% |
| Norwegians | 20.9 /100 | #198 | Fair 5.7% |
| Northern Europeans | 15.2 /100 | #199 | Poor 5.7% |
| Icelanders | 14.6 /100 | #200 | Poor 5.7% |
| Basques | 13.7 /100 | #201 | Poor 5.7% |
| Austrians | 13.2 /100 | #202 | Poor 5.7% |
| Spanish American Indians | 12.8 /100 | #203 | Poor 5.7% |
| Paiute | 11.2 /100 | #204 | Poor 5.7% |
| Trinidadians and Tobagonians | 10.8 /100 | #205 | Poor 5.7% |
| Immigrants | Africa | 10.8 /100 | #206 | Poor 5.7% |
| Moroccans | 10.4 /100 | #207 | Poor 5.7% |