African vs Palestinian Ambulatory Disability
COMPARE
African
Palestinian
Ambulatory Disability
Ambulatory Disability Comparison
Africans
Palestinians
7.0%
AMBULATORY DISABILITY
0.0/ 100
METRIC RATING
303rd/ 347
METRIC RANK
5.7%
AMBULATORY DISABILITY
99.2/ 100
METRIC RATING
82nd/ 347
METRIC RANK
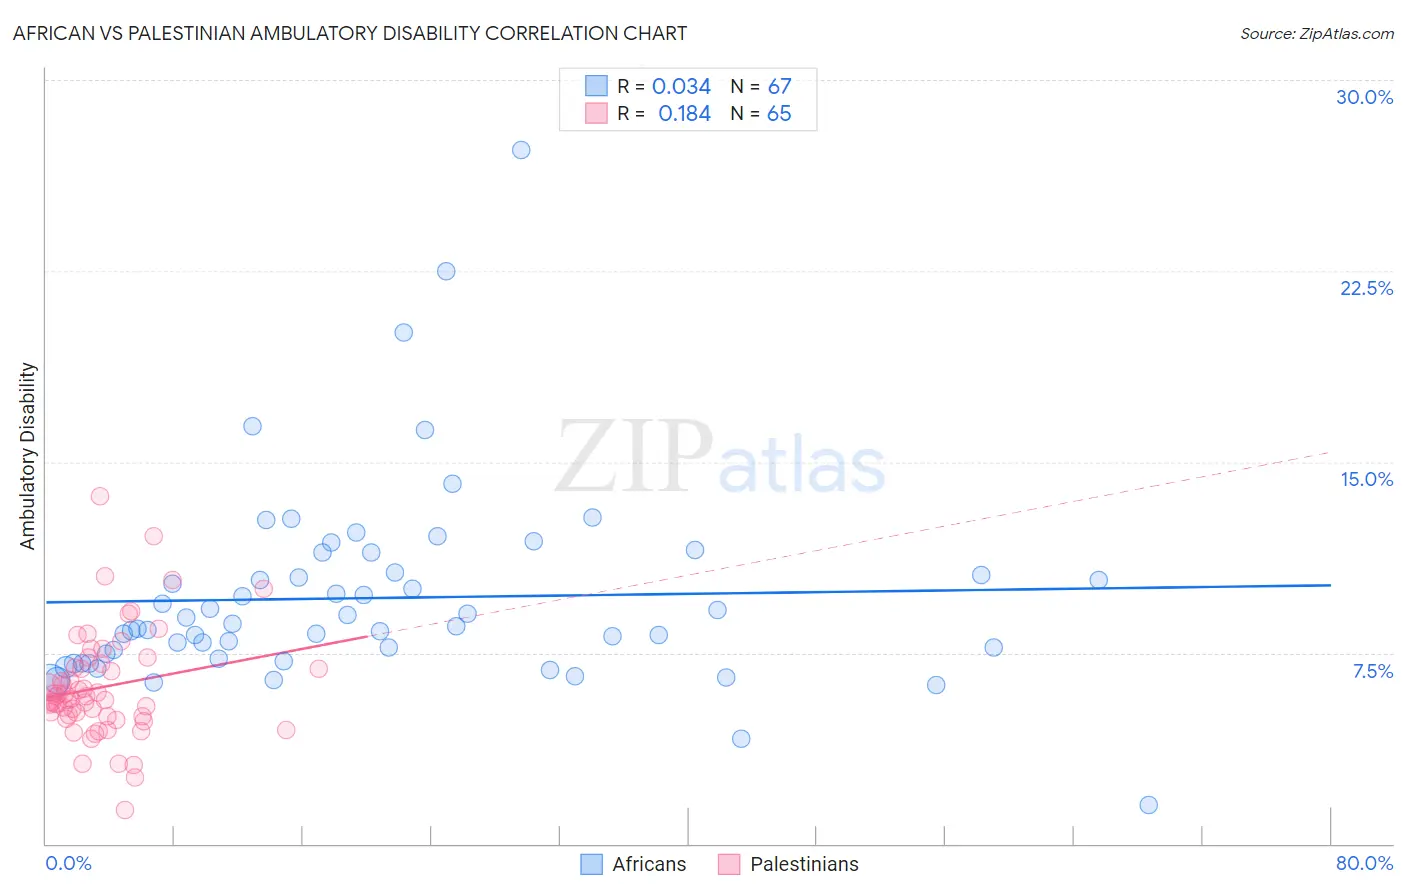
African vs Palestinian Ambulatory Disability Correlation Chart
The statistical analysis conducted on geographies consisting of 469,824,822 people shows no correlation between the proportion of Africans and percentage of population with ambulatory disability in the United States with a correlation coefficient (R) of 0.034 and weighted average of 7.0%. Similarly, the statistical analysis conducted on geographies consisting of 216,450,834 people shows a poor positive correlation between the proportion of Palestinians and percentage of population with ambulatory disability in the United States with a correlation coefficient (R) of 0.184 and weighted average of 5.7%, a difference of 21.6%.
Ambulatory Disability Correlation Summary
| Measurement | African | Palestinian |
| Minimum | 1.5% | 1.3% |
| Maximum | 27.3% | 13.7% |
| Range | 25.7% | 12.3% |
| Mean | 9.7% | 6.2% |
| Median | 8.6% | 5.7% |
| Interquartile 25% (IQ1) | 7.3% | 5.0% |
| Interquartile 75% (IQ3) | 10.6% | 7.0% |
| Interquartile Range (IQR) | 3.4% | 2.0% |
| Standard Deviation (Sample) | 3.9% | 2.1% |
| Standard Deviation (Population) | 3.9% | 2.1% |
Similar Demographics by Ambulatory Disability
Demographics Similar to Africans by Ambulatory Disability
In terms of ambulatory disability, the demographic groups most similar to Africans are Immigrants from Armenia (7.0%, a difference of 0.060%), British West Indian (7.0%, a difference of 0.11%), Marshallese (6.9%, a difference of 0.34%), Puget Sound Salish (6.9%, a difference of 0.35%), and Immigrants from Cabo Verde (7.0%, a difference of 0.36%).
| Demographics | Rating | Rank | Ambulatory Disability |
| Alaskan Athabascans | 0.0 /100 | #296 | Tragic 6.9% |
| French American Indians | 0.0 /100 | #297 | Tragic 6.9% |
| Immigrants | Grenada | 0.0 /100 | #298 | Tragic 6.9% |
| Puget Sound Salish | 0.0 /100 | #299 | Tragic 6.9% |
| Marshallese | 0.0 /100 | #300 | Tragic 6.9% |
| British West Indians | 0.0 /100 | #301 | Tragic 7.0% |
| Immigrants | Armenia | 0.0 /100 | #302 | Tragic 7.0% |
| Africans | 0.0 /100 | #303 | Tragic 7.0% |
| Immigrants | Cabo Verde | 0.0 /100 | #304 | Tragic 7.0% |
| Immigrants | Micronesia | 0.0 /100 | #305 | Tragic 7.0% |
| Iroquois | 0.0 /100 | #306 | Tragic 7.1% |
| Spanish Americans | 0.0 /100 | #307 | Tragic 7.1% |
| Chippewa | 0.0 /100 | #308 | Tragic 7.1% |
| Immigrants | Azores | 0.0 /100 | #309 | Tragic 7.1% |
| Arapaho | 0.0 /100 | #310 | Tragic 7.1% |
Demographics Similar to Palestinians by Ambulatory Disability
In terms of ambulatory disability, the demographic groups most similar to Palestinians are Immigrants from Jordan (5.7%, a difference of 0.0%), Immigrants from Ireland (5.7%, a difference of 0.010%), Eastern European (5.7%, a difference of 0.020%), Ugandan (5.7%, a difference of 0.020%), and Chilean (5.7%, a difference of 0.14%).
| Demographics | Rating | Rank | Ambulatory Disability |
| Immigrants | South Africa | 99.3 /100 | #75 | Exceptional 5.7% |
| Sudanese | 99.3 /100 | #76 | Exceptional 5.7% |
| Immigrants | Vietnam | 99.3 /100 | #77 | Exceptional 5.7% |
| Somalis | 99.2 /100 | #78 | Exceptional 5.7% |
| Chileans | 99.2 /100 | #79 | Exceptional 5.7% |
| Immigrants | Ireland | 99.2 /100 | #80 | Exceptional 5.7% |
| Immigrants | Jordan | 99.2 /100 | #81 | Exceptional 5.7% |
| Palestinians | 99.2 /100 | #82 | Exceptional 5.7% |
| Eastern Europeans | 99.2 /100 | #83 | Exceptional 5.7% |
| Ugandans | 99.2 /100 | #84 | Exceptional 5.7% |
| South Americans | 99.0 /100 | #85 | Exceptional 5.7% |
| Latvians | 99.0 /100 | #86 | Exceptional 5.7% |
| Immigrants | Chile | 98.9 /100 | #87 | Exceptional 5.8% |
| Soviet Union | 98.9 /100 | #88 | Exceptional 5.8% |
| Bhutanese | 98.8 /100 | #89 | Exceptional 5.8% |