Afghan vs Immigrants from Zimbabwe Unemployment Among Ages 25 to 29 years

COMPARE

Afghan
Race
Ancestry
AfghanAfricanAlaska NativeAlaskan AthabascanAlbanianAleutAlsatianAmericanApacheArabArapahoArgentineanArmenianAssyrian/Chaldean/SyriacAustralianAustrianBahamianBangladeshiBarbadianBasqueBelgianBelizeanBermudanBhutaneseBlackfeetBolivianBrazilianBritishBritish West IndianBulgarianBurmeseCajunCambodianCanadianCape VerdeanCarpatho RusynCelticCentral AmericanCentral American IndianCherokeeCheyenneChickasawChileanChineseChippewaChoctawColombianColvilleComancheCosta RicanCreeCreekCroatianCrowCubanCypriotCzechCzechoslovakianDanishDelawareDominicanDutchDutch West IndianEastern EuropeanEcuadorianEgyptianEnglishEstonianEthiopianEuropeanFijianFilipinoFinnishFrenchFrench American IndianFrench CanadianGermanGerman RussianGhanaianGreekGuamanian/ChamorroGuatemalanGuyaneseHaitianHmongHonduranHopiHoumaHungarianIcelanderIndian (Asian)IndonesianInupiatIranianIraqiIrishIroquoisIsraeliItalianJamaicanJapaneseJordanianKenyanKiowaKoreanLaotianLatvianLebaneseLiberianLithuanianLumbeeLuxembourgerMacedonianMalaysianMalteseMarshalleseMenomineeMexicanMexican American IndianMongolianMoroccanNative HawaiianNavajoNepaleseNew ZealanderNicaraguanNigerianNorthern EuropeanNorwegianOkinawanOsageOttawaPaiutePakistaniPalestinianPanamanianParaguayanPennsylvania GermanPeruvianPimaPolishPortuguesePotawatomiPuebloPuerto RicanPuget Sound SalishRomanianRussianSalvadoranSamoanScandinavianScotch-IrishScottishSeminoleSenegaleseSerbianShoshoneSierra LeoneanSiouxSlavicSlovakSloveneSomaliSouth AfricanSouth AmericanSouth American IndianSoviet UnionSpaniardSpanishSpanish AmericanSpanish American IndianSri LankanSubsaharan AfricanSudaneseSwedishSwissSyrianTaiwaneseThaiTlingit-HaidaTohono O'OdhamTonganTrinidadian and TobagonianTsimshianTurkishU.S. Virgin IslanderUgandanUkrainianUruguayanUteVenezuelanVietnameseWelshWest IndianYakamaYaquiYugoslavianYumanYup'ikZimbabwean
Immigration
NonimmigrantsImmigrantsAfghanistanAfricaAlbaniaArgentinaArmeniaAsiaAustraliaAustriaBahamasBangladeshBarbadosBelarusBelgiumBelizeBoliviaBosnia and HerzegovinaBrazilBulgariaBurma/MyanmarCabo VerdeCambodiaCameroonCanadaCaribbeanCentral AmericaChileChinaColombiaCongoCosta RicaCroatiaCubaCzechoslovakiaDenmarkDominicaDominican RepublicEastern AfricaEastern AsiaEastern EuropeEcuadorEgyptEl SalvadorEnglandEritreaEthiopiaEuropeFijiFranceGermanyGhanaGreeceGrenadaGuatemalaGuyanaHaitiHondurasHong KongHungaryIndiaIndonesiaIranIraqIrelandIsraelItalyJamaicaJapanJordanKazakhstanKenyaKoreaKuwaitLaosLatin AmericaLatviaLebanonLiberiaLithuaniaMalaysiaMexicoMicronesiaMiddle AfricaMoldovaMoroccoNepalNetherlandsNicaraguaNigeriaNorth AmericaNorth MacedoniaNorthern AfricaNorthern EuropeNorwayOceaniaPakistanPanamaPeruPhilippinesPolandPortugalRomaniaRussiaSaudi ArabiaScotlandSenegalSerbiaSierra LeoneSingaporeSomaliaSouth AfricaSouth AmericaSouth Central AsiaSouth Eastern AsiaSouthern EuropeSpainSri LankaSt. Vincent and the GrenadinesSudanSwedenSwitzerlandSyriaTaiwanThailandTrinidad and TobagoTurkeyUgandaUkraineUruguayUzbekistanVenezuelaVietnamWest IndiesWestern AfricaWestern AsiaWestern EuropeYemenZaireAzores
Immigrants from Zimbabwe
Race
Ancestry
AfricanAlaska NativeAlaskan AthabascanAlbanianAleutAlsatianAmericanApacheArabArapahoArgentineanArmenianAssyrian/Chaldean/SyriacAustralianAustrianBahamianBangladeshiBarbadianBasqueBelgianBelizeanBermudanBhutaneseBlackfeetBolivianBrazilianBritishBritish West IndianBulgarianBurmeseCajunCambodianCanadianCape VerdeanCarpatho RusynCelticCentral AmericanCentral American IndianCherokeeCheyenneChickasawChileanChineseChippewaChoctawColombianColvilleComancheCosta RicanCreeCreekCroatianCrowCubanCypriotCzechCzechoslovakianDanishDelawareDominicanDutchDutch West IndianEastern EuropeanEcuadorianEgyptianEnglishEstonianEthiopianEuropeanFijianFilipinoFinnishFrenchFrench American IndianFrench CanadianGermanGerman RussianGhanaianGreekGuamanian/ChamorroGuatemalanGuyaneseHaitianHmongHonduranHopiHoumaHungarianIcelanderIndian (Asian)IndonesianInupiatIranianIraqiIrishIroquoisIsraeliItalianJamaicanJapaneseJordanianKenyanKiowaKoreanLaotianLatvianLebaneseLiberianLithuanianLumbeeLuxembourgerMacedonianMalaysianMalteseMarshalleseMenomineeMexicanMexican American IndianMongolianMoroccanNative HawaiianNavajoNepaleseNew ZealanderNicaraguanNigerianNorthern EuropeanNorwegianOkinawanOsageOttawaPaiutePakistaniPalestinianPanamanianParaguayanPennsylvania GermanPeruvianPimaPolishPortuguesePotawatomiPuebloPuerto RicanPuget Sound SalishRomanianRussianSalvadoranSamoanScandinavianScotch-IrishScottishSeminoleSenegaleseSerbianShoshoneSierra LeoneanSiouxSlavicSlovakSloveneSomaliSouth AfricanSouth AmericanSouth American IndianSoviet UnionSpaniardSpanishSpanish AmericanSpanish American IndianSri LankanSubsaharan AfricanSudaneseSwedishSwissSyrianTaiwaneseThaiTlingit-HaidaTohono O'OdhamTonganTrinidadian and TobagonianTsimshianTurkishU.S. Virgin IslanderUgandanUkrainianUruguayanUteVenezuelanVietnameseWelshWest IndianYakamaYaquiYugoslavianYumanYup'ikZimbabwean
Immigration
NonimmigrantsImmigrantsAfghanistanAfricaAlbaniaArgentinaArmeniaAsiaAustraliaAustriaBahamasBangladeshBarbadosBelarusBelgiumBelizeBoliviaBosnia and HerzegovinaBrazilBulgariaBurma/MyanmarCabo VerdeCambodiaCameroonCanadaCaribbeanCentral AmericaChileChinaColombiaCongoCosta RicaCroatiaCubaCzechoslovakiaDenmarkDominicaDominican RepublicEastern AfricaEastern AsiaEastern EuropeEcuadorEgyptEl SalvadorEnglandEritreaEthiopiaEuropeFijiFranceGermanyGhanaGreeceGrenadaGuatemalaGuyanaHaitiHondurasHong KongHungaryIndiaIndonesiaIranIraqIrelandIsraelItalyJamaicaJapanJordanKazakhstanKenyaKoreaKuwaitLaosLatin AmericaLatviaLebanonLiberiaLithuaniaMalaysiaMexicoMicronesiaMiddle AfricaMoldovaMoroccoNepalNetherlandsNicaraguaNigeriaNorth AmericaNorth MacedoniaNorthern AfricaNorthern EuropeNorwayOceaniaPakistanPanamaPeruPhilippinesPolandPortugalRomaniaRussiaSaudi ArabiaScotlandSenegalSerbiaSierra LeoneSingaporeSomaliaSouth AfricaSouth AmericaSouth Central AsiaSouth Eastern AsiaSouthern EuropeSpainSri LankaSt. Vincent and the GrenadinesSudanSwedenSwitzerlandSyriaTaiwanThailandTrinidad and TobagoTurkeyUgandaUkraineUruguayUzbekistanVenezuelaVietnamWest IndiesWestern AfricaWestern AsiaWestern EuropeYemenZaireZimbabweAzores
Unemployment Among Ages 25 to 29 years
Income
Poverty
Unemployment
Labor Participation
Family Structure
Vehicle Availability
Education Level
Disability

Unemployment Among Ages 25 to 29 years Comparison

Afghans

Immigrants from Zimbabwe

Exceptional
Exceptional
6.4%
UNEMPLOYMENT AMONG AGES 25 TO 29 YEARS
92.5/ 100
METRIC RATING
95th/ 347
METRIC RANK
6.1%
UNEMPLOYMENT AMONG AGES 25 TO 29 YEARS
99.5/ 100
METRIC RATING
35th/ 347
METRIC RANK

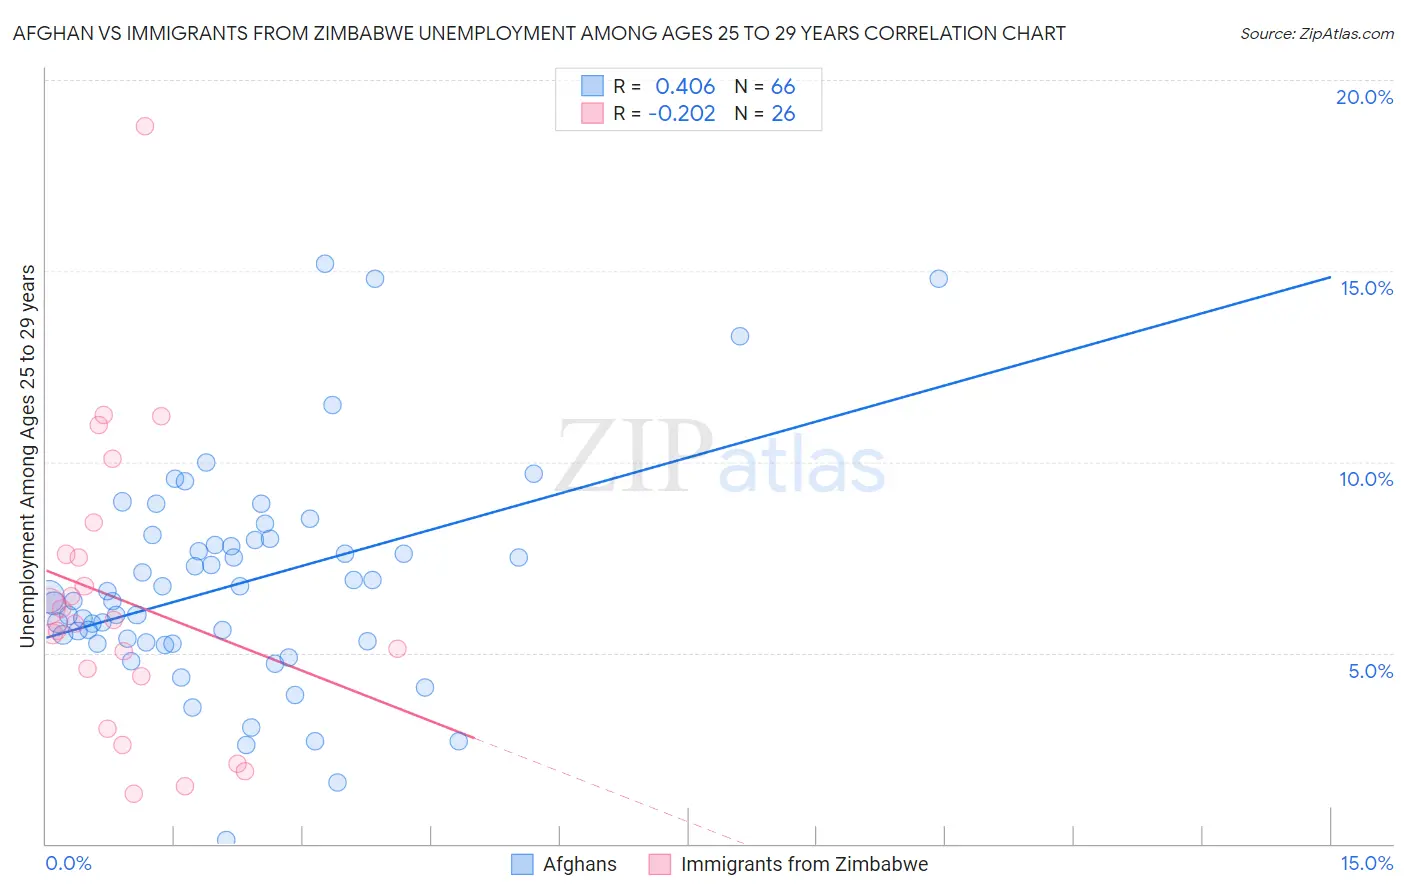
Afghan vs Immigrants from Zimbabwe Unemployment Among Ages 25 to 29 years Correlation Chart

The statistical analysis conducted on geographies consisting of 147,163,258 people shows a moderate positive correlation between the proportion of Afghans and unemployment rate among population between the ages 25 and 29 in the United States with a correlation coefficient (R) of 0.406 and weighted average of 6.4%. Similarly, the statistical analysis conducted on geographies consisting of 116,035,324 people shows a weak negative correlation between the proportion of Immigrants from Zimbabwe and unemployment rate among population between the ages 25 and 29 in the United States with a correlation coefficient (R) of -0.202 and weighted average of 6.1%, a difference of 4.6%.
Afghan vs Immigrants from Zimbabwe Unemployment Among Ages 25 to 29 years

Unemployment Among Ages 25 to 29 years Correlation Summary

MeasurementAfghanImmigrants from Zimbabwe
Minimum0.10%1.3%
Maximum15.2%18.8%
Range15.1%17.5%
Mean6.8%6.4%
Median6.4%5.8%
Interquartile 25% (IQ1)5.3%4.4%
Interquartile 75% (IQ3)7.9%7.6%
Interquartile Range (IQR)2.7%3.2%
Standard Deviation (Sample)2.9%3.8%
Standard Deviation (Population)2.8%3.8%

Similar Demographics by Unemployment Among Ages 25 to 29 years

Demographics Similar to Afghans by Unemployment Among Ages 25 to 29 years

In terms of unemployment among ages 25 to 29 years, the demographic groups most similar to Afghans are Immigrants from Brazil (6.4%, a difference of 0.080%), Immigrants from Eastern Europe (6.4%, a difference of 0.14%), Serbian (6.4%, a difference of 0.17%), Zimbabwean (6.4%, a difference of 0.24%), and Iraqi (6.4%, a difference of 0.25%).
DemographicsRating | RankUnemployment Among Ages 25 to 29 years
Immigrants | Indonesia
94.5
/100
|
#88
Exceptional
6.4%
Immigrants | Oceania
94.1
/100
|
#89
Exceptional
6.4%
Lebanese
93.9
/100
|
#90
Exceptional
6.4%
Egyptians
93.9
/100
|
#91
Exceptional
6.4%
Immigrants | North Macedonia
93.6
/100
|
#92
Exceptional
6.4%
Australians
93.6
/100
|
#93
Exceptional
6.4%
Zimbabweans
93.5
/100
|
#94
Exceptional
6.4%
Afghans
92.5
/100
|
#95
Exceptional
6.4%
Immigrants | Brazil
92.1
/100
|
#96
Exceptional
6.4%
Immigrants | Eastern Europe
91.9
/100
|
#97
Exceptional
6.4%
Serbians
91.7
/100
|
#98
Exceptional
6.4%
Iraqis
91.3
/100
|
#99
Exceptional
6.4%
Uruguayans
91.2
/100
|
#100
Exceptional
6.4%
Immigrants | Ireland
91.1
/100
|
#101
Exceptional
6.4%
British
90.5
/100
|
#102
Exceptional
6.4%

Demographics Similar to Immigrants from Zimbabwe by Unemployment Among Ages 25 to 29 years

In terms of unemployment among ages 25 to 29 years, the demographic groups most similar to Immigrants from Zimbabwe are Taiwanese (6.1%, a difference of 0.020%), Immigrants from Morocco (6.1%, a difference of 0.040%), Immigrants from Serbia (6.1%, a difference of 0.070%), Ethiopian (6.1%, a difference of 0.21%), and Yugoslavian (6.1%, a difference of 0.30%).
DemographicsRating | RankUnemployment Among Ages 25 to 29 years
Danes
99.7
/100
|
#28
Exceptional
6.0%
Immigrants | South Central Asia
99.7
/100
|
#29
Exceptional
6.1%
Bulgarians
99.7
/100
|
#30
Exceptional
6.1%
Filipinos
99.7
/100
|
#31
Exceptional
6.1%
Chinese
99.6
/100
|
#32
Exceptional
6.1%
Yugoslavians
99.6
/100
|
#33
Exceptional
6.1%
Immigrants | Morocco
99.5
/100
|
#34
Exceptional
6.1%
Immigrants | Zimbabwe
99.5
/100
|
#35
Exceptional
6.1%
Taiwanese
99.5
/100
|
#36
Exceptional
6.1%
Immigrants | Serbia
99.5
/100
|
#37
Exceptional
6.1%
Ethiopians
99.4
/100
|
#38
Exceptional
6.1%
Indonesians
99.3
/100
|
#39
Exceptional
6.1%
Immigrants | Kenya
99.3
/100
|
#40
Exceptional
6.1%
Fijians
99.3
/100
|
#41
Exceptional
6.1%
Jordanians
99.3
/100
|
#42
Exceptional
6.1%